Download
1 / 25
250 likes | 379 Views
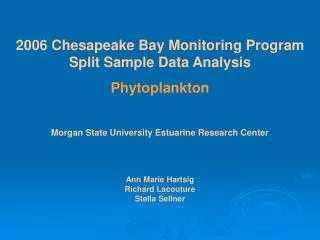
Chesapeake Bay Program Monitoring Activities and Monitoring Network Design. Stephen D. Preston U.S. Geological Survey / Chesapeake Bay Program Office Annapolis, Maryland. NY. PA. MD. DE. WV. VA. Chesapeake Bay Geography. Watershed Characteristics

E N D
Chesapeake Bay Program Monitoring Activities and Monitoring Network Design Stephen D. Preston U.S. Geological Survey / Chesapeake Bay Program Office Annapolis, Maryland
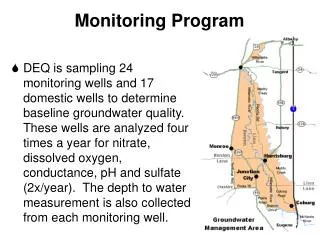
NY PA MD DE WV VA Chesapeake Bay Geography Watershed Characteristics * 64,000 square miles in area * includes parts of six States & DC * 9 major drainages Chesapeake Bay Watershed Land Use Bay Characteristics * 4,500 square miles in area * encompassed by two States MD and VA * most drainage comes from PA, MD and VA
Chesapeake Bay Impairments Variety of Ecological Impacts - Eutrophication • Anoxia • Seasonal Algal Blooms • Loss of Submerged Aquatic Vegetation • Loss of Economically Important Species
Objectives of Tidal Monitoring • A. Characterization, Status • - Water-Quality Criteria • - Nutrient Reduction Goals • - Biological and Ecological Indicators • B. Temporal Changes - Long-Term Trends • C. Tidal Water-Quality Modeling • D. Understanding of Processes Related to the • Attainment of Water-Quality Criteria and • Other Restoration Goals
Designated Uses for Chesapeake Bay A. Cross Section of Chesapeake Bay or Tidal Tributary Shallow Water Open Water Deep Water Deep Channel B. Oblique View of the “Chesapeake Bay” and its Tidal Tributaries Migratory Finfish Spawning and Nursery Habitat Open Water Habitat Shallow Water Habitat Deep Water Deep Channel
Spatial Extent of Tidal Monitoring CBP Monitoring Segmentation
Potential Approaches for Tidal Monitoring A. Buoy Systems * Potential Need - Dissolved Oxygen Criteria B. Probability-Based Monitoring * Potential Need - Shallow-Water Monitoring C. Fixed-Station Monitoring * Potential Need - All Objectives, Some Designated Uses D. Continuous Underway Monitoring Systems * Potential Need - Detailed Spatial Assessment E. Remote Sensing (Aerial Over-flights, Satellite Imagery) * Potential Need - Chlorophyll Criteria Attainment
Fixed-Station Water-Quality Monitoring Network in Relation to the Open Water, Deep Water and Deep Channel Designated Uses
Non-Tidal Water-Quality Monitoring Network Design
Objectives of Non-Tidal Monitoring A. Flux from the Watershed - Load Estimation B. Temporal Changes - Long-Term Trends C. Effectiveness of BMP’s - Watershed Modeling D. Research / Education
Objectives – Load Estimation WRIR 99-4238, Belval and Sprague
Objectives – Trend Analysis WRIR 98-4192, Langland
NITROGEN SOURCES URBAN FOREST DELIVERED LOAD, IN 105 KILOGRAMS PER YEAR AGRICULTURE SEPTIC ATMOSPHERIC gm / m2-yr POINT SOURCE 0 - 0 . 1 0 . 1 - 0 . 2 1985 1998 Patuxent River . 2 - . 3 0 0 . 3 - . 4 0 0 0 . 4 - 0 . 5 . 5 - . 6 0 0 Patuxent River Basin 0 0 . 6 - . 7 Total Nitrogen Delivered Yield 0 . 7 - 0 . 8 8 8 , 0 0 0 0 . 8 - 0 . 9 0 . 9 - 1 6 2 . N o d a t a 6 6 , 0 0 0 CONCENTRATION, IN MILLIGRAMS PER LITER 4 , 0 0 0 4 2 2 , 0 0 0 0 0 Factors Affecting Nutrient Trends In Major Rivers of the Chesapeake Bay Watershed Sprague and others (2000) WRIR 00-4218 TOTAL NITROGEN DISCHARGE, IN CUBIC FEET PER SECOND 1 9 8 5 1 9 8 7 1 9 8 9 1 9 9 1 1 9 9 3 1 9 9 5 1 9 9 7 EXPLANATION DAILY MEAN DISCHARGE CONCENTRATION
Chesapeake Bay Stream-Load Data Base Time Period - 1987 Time Period - 1992
“Non-tidal”data base • Constructed in mid-1990’s (NSC/USGS) • Contains nutrient and sediment data collected by State, Federal, and NGO’s. • 3 years minimum • Updated through 2002 • Linked to GIS so allows for analysis
Initial Network Design • 703 Stream Gages • 313 Active Stream Gages 389 Active Water-Quality • >1700 Water Quality • 176 QW Associated with Stream Gages • 118 Sites Meet Frequency and/or Parameter Criteria for trends
Implementation of strategies to meet water-quality criteria Nontidal network will provide first measure of water-quality improvements Nontidal Water-Quality Monitoring
Areas of different loadings • Enhance network to target nutrient sources and loads • Assess reductions • Using SPARROW late 1990s version
Initial Network Design • Evaluate current sites • Propose new locations • Tributary Basin boundaries • High load areas