Download
1 / 40
400 likes | 661 Views
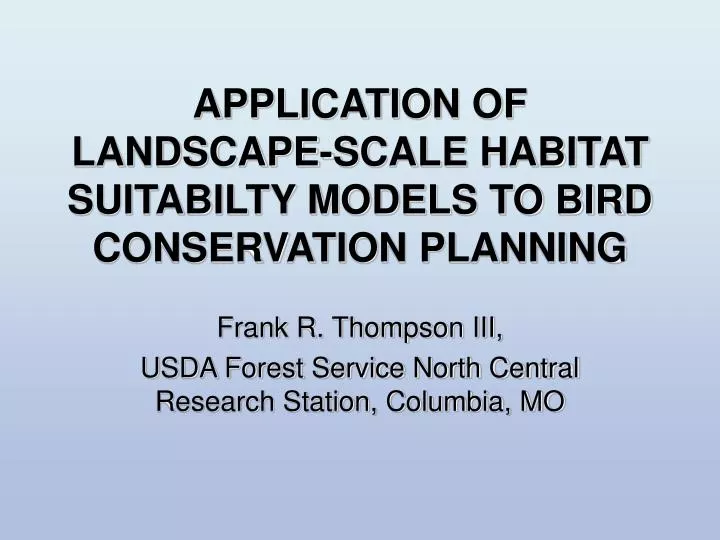
APPLICATION OF LANDSCAPE-SCALE HABITAT SUITABILTY MODELS TO BIRD CONSERVATION PLANNING. Frank R. Thompson III, USDA Forest Service North Central Research Station, Columbia, MO . Application of landscape-scale habitat suitability models to bird conservation planning. Review concept of HSI

E N D
APPLICATION OF LANDSCAPE-SCALE HABITAT SUITABILTY MODELS TO BIRD CONSERVATION PLANNING Frank R. Thompson III, USDA Forest Service North Central Research Station, Columbia, MO
Application of landscape-scale habitat suitability models to bird conservation planning • Review concept of HSI • Look at historical application • Adapt HSI to landscape-scale, GIS-based applications for conservation planning
HSI model basics • Numerical index of habitat suitability on a 0.0 to 1.0 scale • Models can be based on published knowledge, data, expert opinion • Documentation explains the model's structure, data sources, and assumptions • Models should be viewed as hypotheses of species-habitat relationships • Their value is to serve as a basis for improved decision making and increased understanding of habitat relationships; they specify hypotheses of habitat relationships that can be tested and improved.
Original HSI formulation HSI = (V1 x V2 x V3)1/3 V1….Vx = limiting factors or life requisites; if any one variable=0 then HSI = 0
USFWS HSI model series • U.S. Fish and Wildlife Service. 1980a. Habitat Evaluation Procedures (HEP). USDI Fish and Wildlife Service. Division of Ecological Services. ESM 102. • U.S. Fish and Wildlife Service. 1981. Standards for the development of habitat suitability index models for use in the Habitat Evaluation Procedures, USDI Fish and Wildife Service. Division of Ecological Services. ESM 103.
Yellow warbler HSI model (USFWS 1982) % deciduous shrub cover Mean height decid. shrub cover % hydrophytic shrubs HSI = (V1X V2X V3) 1/3
HSI models for conservation planning • Applicable to larger scales • Applicable in GIS • Utilize available data • Address concepts of abundance and viability
Adapting HSI models to raster-based GIS • SIs and HSI values calculated for each pixel • Results in a new data layers representing maps of SI and HSI values • SIs can be based on pixel attributes or attributes of surrounding pixels • Can utilize wide range of GIS functions or landscape statistics • HSI values can be summarized for the landscape
Acadian flycatcher HSI model(in development) • SI1: We considered birds to be densest (relative density = 1.000) in mature (Pagen et al. 2002) woody wetlands (Sallabanks et al. 2000) along floodplains and valleys (Klaus et al. 2005) and scarcest in sapling evergreen stands along xeric slopes and ridges.
Acadian flycatcher HSI model(in development) • SI2: We fit an inverse logistic function to describe the relationship between Acadian relative density and increasing distance to water. Acadians normally align at least 1 edge of their 1-ha territory along a stream or wetland (Woolfenden et al. 2005).
Acadian flycatcher SI2 Suitability Distance to water
Acadian flycatcher HSI model(in development) • SI3: …..included canopy closure (SI3) because of its strong effect on Acadian flycatcher density (Prather and Smith 2002). …we utilized a smoothed logistic function to extrapolate between the known break points in the canopy cover-relative density relationship.
Acadian flycatcher SI3 Suitability Percent canopy closure
Acadian flycatcher HSI model(in development) • SI4: Forest patch size was included as a model factor because of the susceptibility of Acadian flycatchers to fragmentation (Robbins et al. 1989) and increasing edge density (Parker et al. 2005). We used a logarithmic function to describe the relatively quick increase in suitability of a forest patch as area increased (Robbins et al. 1989).
Acadian flycatcher SI4 Suitability Suitability Forest-patch size Forest-patch size
Acadian flycatcher HSI model(in development) • SI5: This factor accounted for the higher parasitism (Robinson and Robinson 2001) and predation rates (Ford et al. 2001) of increasingly non-forested landscapes. The smoothed logistic function was derived from data collected by Ford et al. (2001) on the difference between sites 80 and 90% forested. The dramatic decline in productivity in increasingly non-forested landscapes was hypothesized from the edge avoidance of this species (Parker et al. 2005) and the absence of Acadians from small fragments (Robbins et al. 1989).
Acadian flycatcher SI5 Suitability Percent forest cover
Acadian flycatcher HSI model(in development) • SI1: forest type and age-class • SI2: distance to water • SI3: canopy closure • SI4: patch size • SI5: percent forest cover Relative density HSI = ((SI1 * SI2 * SI3)1/3) * SI4 Relative productivity HSI = SI5
Mid-late successional forest species Area/edge sensitive Ovenbird Illustration by Trevor Boyer, Linden Artists Ltd. • GIS data layers • Forest-type groups • Forest/tree age class • Ecological land types based on landform
Mesic Dry Ovenbird SI1
Ovenbird SI2 • If species = pine, then SI2 = 0 • Otherwise, SI2 = 1
Ovenbird SI3 SI1 SI3 30 m SI=0 SI=0.5 SI=1 SI=1
Ovenbird SI1 HSI SI2 0.25 km SI3 HSI = (SI1 SI2 SI3)1/3
Ecological and landscape effects • Area sensitivity • Edge effects • Interspersion • Composition • Juxtaposition of resources
Summarizing HSI values for a landscape • Maps • Descriptive statistics (mean, median, sum) • Frequency distributions • Input to other programs that map home ranges, model population dynamics
Tree size class OVEN HSI PIWA HSI PRWA HSI
Summarizing HSI values for a landscape Landscape 1 Landscape 2
Summarizing HSI values for a landscape Ovenbird 0.70 Gray squirrel 0.44 Prairie warbler 0.02
Cerulean warbler HSI
Summarizing HSI values for a landscape • Input to other models • Link HSI values to density • directly with data • map territories • Use HSI maps as input to spatially explicit population models
HSI modeling approaches • Can be developed from existing knowledge or data which can include data, published knowledge, and expert opinion. (+) • Can use multiple sources of information for SIs or multiple scales within a model. (+) • Models can be developed for at any desired scale as long as have hypotheses for that scale. (+) • Can adapt habitat relationships from research studies to available data sources for conservation planning. (+)
HSI modeling approaches • Predict habitat suitability or quality, not necessarily abundance or density. (+ or -) • Methods for weighting and combining habitat and landscape factors (suitability indices) are somewhat ad-hoc. (-) • Models are based on hypotheses (+) • Models are essentially hypotheses until validated (-)