Download
1 / 1
10 likes | 94 Views
Figure S1. (PI). Phosphatidylinositol 3-kinase. Phosphatidylinositol 4-phosphate 3-kinase.

E N D
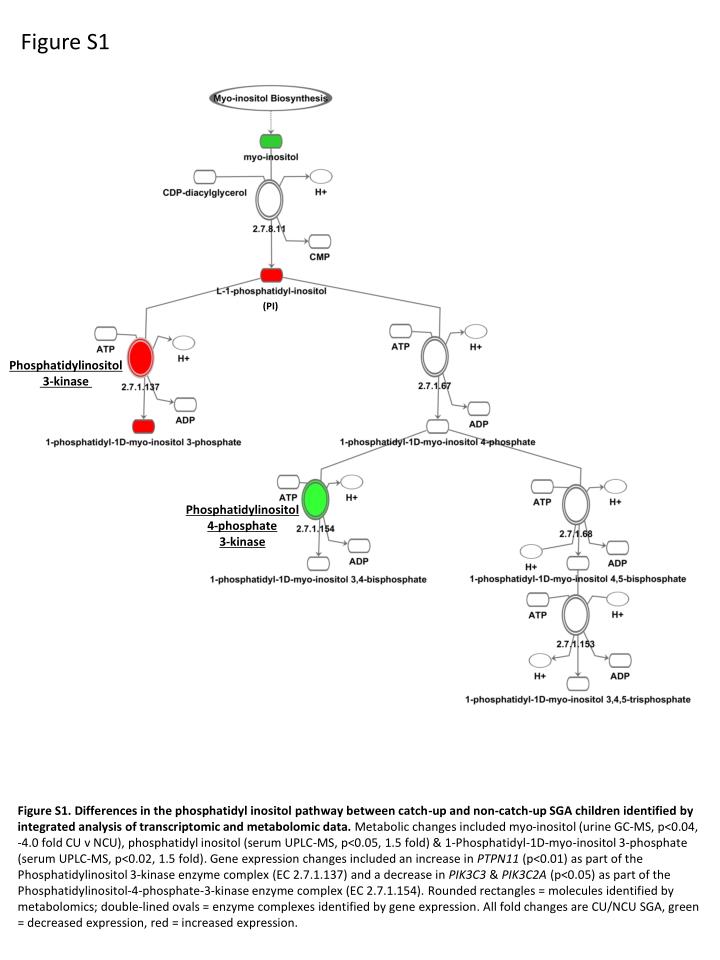
Figure S1 (PI) Phosphatidylinositol 3-kinase Phosphatidylinositol 4-phosphate 3-kinase Figure S1. Differences in the phosphatidyl inositol pathway between catch-up and non-catch-up SGA children identified by integrated analysis of transcriptomic and metabolomic data. Metabolic changes included myo-inositol (urine GC-MS, p<0.04, -4.0 fold CU v NCU), phosphatidyl inositol (serum UPLC-MS, p<0.05, 1.5 fold) & 1-Phosphatidyl-1D-myo-inositol 3-phosphate (serum UPLC-MS, p<0.02, 1.5 fold). Gene expression changes included an increase in PTPN11 (p<0.01) as part of the Phosphatidylinositol 3-kinase enzyme complex (EC 2.7.1.137) and a decrease in PIK3C3 & PIK3C2A (p<0.05) as part of the Phosphatidylinositol-4-phosphate-3-kinase enzyme complex (EC 2.7.1.154). Rounded rectangles = molecules identified by metabolomics; double-lined ovals = enzyme complexes identified by gene expression. All fold changes are CU/NCU SGA, green = decreased expression, red = increased expression.