Download
1 / 18
180 likes | 287 Views
The Sampling Distribution. Introduction to Hypothesis Testing and Interval Estimation. Outline. Distinctions Sampling Distribution The Central Limit Theorem Confidence Intervals. Random Sampling. Key things to keep in mind. Population- what we want to talk about

E N D
The Sampling Distribution Introduction to Hypothesis Testing and Interval Estimation
Outline • Distinctions • Sampling Distribution • The Central Limit Theorem • Confidence Intervals
Key things to keep in mind • Population- what we want to talk about • Sample- what we have with our data • Sampling distribution- the means by which we will go from our sample to the population
Sampling Distribution • Sampling distributions concern any statistic we can come up with. Examples: • Measures of Central Tendency • Measures of Variability • Measures of Relationship • Ratios • Sample != sampling distribution • Recall also that sampling distributions can be theoretical (used in most studies) or empirical (seeing wider use via bootstrapping). • It is the properties of the sampling distribution
Central Limit Theorem (CLT) • Suppose X is • random • mean • standard deviation • not necessarily normal
Terms Concerning Sampling Distribution of the Mean • Standard Error of the mean: • Is just the standard deviation of the sampling distribution. • i.e. it is a particular standard deviation • Sampling error • The sample cannot be fully representative of the population • As such, there is variability due to chance • We could have a thousand sample means and none of them equal exactly the population mean. However…
CLT (continued) • Properties of the sampling distribution of the mean • random • has a mean of • has a standard error • Distributed approximately normal for large samples • Normal for all samples if the variable X is normal
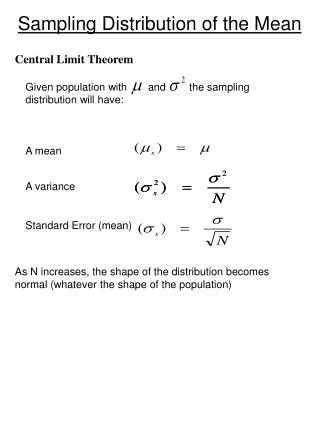
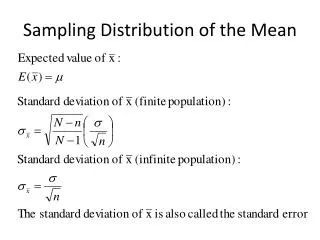
The Central Limit Theorem • For any population of scores, regardless of form, the sampling distribution of the mean will approach a normal distribution as the sample size (N) gets larger. • This of course begs the question of what is ‘large enough’ • Furthermore, the sampling distribution of the mean will have a mean equal to µ (the population mean), and a standard deviation equal to
Central Limit Theorem • With the mean, we can use sample data and the normal curve to reach conclusions about the population of interest • We of course desire large, random samples in order to do • Non-random selection can result in under-selection or over-selection of subsections of the population. • e.g. carry out a telephone opinion poll • http://www.ruf.rice.edu/~lane/stat_sim/sampling_dist/index.html
In summary: sample means • are random • are normally distributed for large sample sizes • distribution has mean • distribution has standard error (standard deviation)
Confidence intervals • Draw a sample, gives us a mean • is our best guess at µ • For most samples will be close to µ • is a ‘point’ estimate • However, we can also give a range or interval estimate that takes into account the uncertainty involved in that estimate • Using the normal distribution
Confidence interval equation Where = sample mean Z = z value from normal curve = standard error of the mean
95% confidence interval • Let’s say we want a 95% confidence interval. • Obtain1 the ‘critical’ z-score for p =.025 • 2.5% above +z, and 2.5% below -z • p = .025 then z = 1.96 • When the population standard deviation is not known, we use the t critical value instead
Confidence interval example • Randomly selected a group of 10 of you folks with a mean score of 89 (s = 6) on the midterm. • What guess can we make as to the true mean of the class?
89 + 2.26* • 89 + 2.26(1.90) • (89 - 4.294) < < (89 + 4.294) • 84.71 < < 93.294 • This seems pretty wide; it essentially covers a full letter grade. Why do you think that is?
Important: what a confidence interval means • A 95% confidence interval means that: 95% of the confidence intervals calculated on repeated sampling of the same population will contain µ • Note that the population value does not vary i.e. it’s not a 95% chance that it falls in that specific interval1 • In other words, the CI attempts to capture the true population mean, but we would have a different interval estimate for each sample drawn • http://www.ruf.rice.edu/~lane/stat_sim/conf_interval/index.html • In R library(animation) conf.int(.95)
Question to think about • How does one know if the confidence interval calculated actually contains the true population mean?