Download
1 / 11
120 likes | 254 Views
2.5-2.6 Graphing Absolute Functions. Complete the table and graph the points. y = l x l. Complete the table and graph the points. y = l x – 2l + 3. Vertex Form. y = a l x – h l + k (h, k) is the vertex of the “V” (if the sign doesn’t match the coordinate is negative)

E N D
Complete the table and graph the points y = l x l
Complete the table and graph the points y = l x – 2l + 3
Vertex Form y = alx – hl + k (h, k) is the vertex of the “V” (if the sign doesn’t match the coordinate is negative) Identify the vertex • y = Ix + 3I – 1 • y = Ix – 5I + 6 • y = Ix + 4I + 3
Graphing Absolute Value • Identify and plot the vertex and decide whether the graph opens up or down. • Set up a table of values • Pick x-values on both sides of you vertex • Plot the points • Connect with lines (should be a “V” shape)
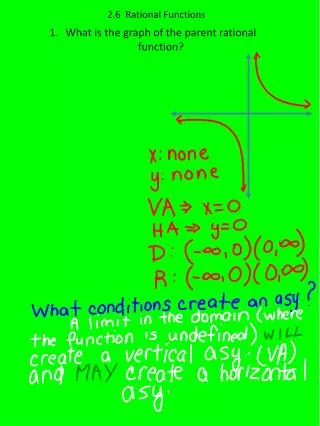
- If a>1 then the graph is narrower than y=lxl -if a<1 the graph is wider than the graph of y=lxl -if a is negative the v opens down -if a is positive the v opens up (a is the + and - slope of the two sides of the graph)
Graph each absolute value function • y = I x – 1I + 2 • y =2 I x +3I – 1 • y = - I x + 2I + 4
Graphing absolute value on the calculator • “y=“ • Clear out any equations • Enter function in to y1= • To use absolute value symbols: • Math key, tab one to the right for “NUM” • Abs( is the first item on the menu so hit enter.
Writing an absolute value function from a graph • -substitute the vertex read off the graph for h and k • solve for “a” by plugging in any point on the graph for x and y. • -plug the value you find in for a into the equation. • Ex.
Suppose you are playing air hockey on an 8”by 4” table. The starting point of the puck is at (1,2). You wish to bank the puck off the side of the table at (5,4)and score a goal which is located at (8,2). Write the absolute value equation that this situation represents and decide whether or not you will score the goal.
Absolute Value • An exclusive restaurant is open from 3:00 pm until 10:00 pm. Each evening, the number of people served S increases steadily and then decreases according to the model • Where t=0 represents 12:00 pm. • Use your calculator to graph the function and find the vertex. Explain what each coordinate of the vertex represents.