Download
1 / 33
370 likes | 494 Views
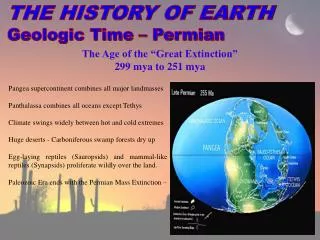
The Middle Pliocene (~3.0 Mya) The Last Great Global Warming. The Cenozoic CO2 Decline. The Phanerozoic Temperature Record. The Cenozoic Thermal Decline. Mid-Pliocene Time Slab. ODP Site 981. After Draut et al. (2003). PRISM Time Slab and Peak Averaging.

E N D
Mid-Pliocene Time Slab ODP Site 981 After Draut et al. (2003)
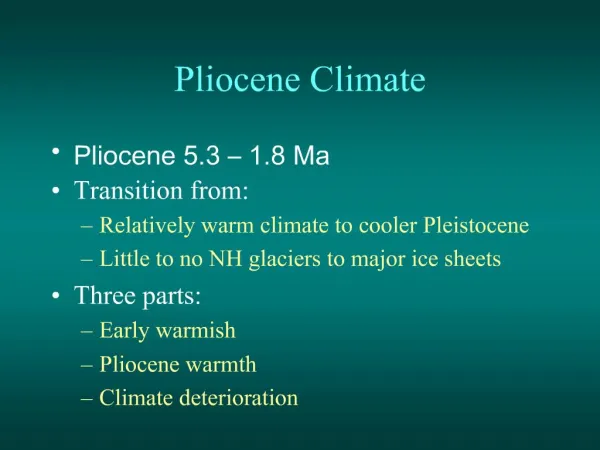
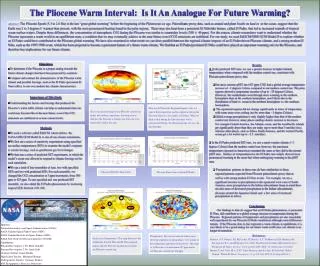
PRISM Time Slab and Peak Averaging The PRISM2 reconstructions are a global synthesis of a period of relatively warm and stable climate lying between the transition of oxygen isotope stages M2/M1 and G19/G18 in the middle part of the Gauss Normal Polarity Chron. The reconstruction spans the interval of 3.29 Ma to 2.97 Ma (geomagnetic polarity time scale of Berggren et al., 1995) This interval occurs prior to the 2.5-2.4 Ma oxygen isotope excursion which represents a major climate step toward modern conditions (northern hemisphere ice volume increased, polar fronts were strengthened and glacial-interglacial variation intensified). Peak warming
Middle Pliocene Sea Level Rise B) A) Modern Shoreline Pliocene Shoreline A) Based upon marine stable isotope records, sequence stratigraphy, and ancient shorelines, mid Pliocene sea level is estimated to be +25 m relative to today. B) This image shows a section of the Orangeburg Scarp in Georgia, dated at 3.5-3.0 Ma. The Orangeburg Scarp suggests a sea level 35±17m relative to today.
Two Caveatsto the original global warming simulations: • A “business as usual” approach would lead to increased global temperatures IF greenhouse gas increases were anthropogenic in origin.
Two Caveatsto the original global warming simulations: • A “business as usual” approach would lead to increased global temperatures IF greenhouse gas increases were anthropogenic in origin. • All results were contingent upon a “surprise-free” ocean response. X
Two Caveatsto the original global warming simulations: • A “business as usual” approach would lead to increased global temperatures IF greenhouse gas increases were anthropogenic in origin. • All results were contingent upon a “surprise-free” ocean response. X ?
PRISM2 Reconstruction(PRISM = Pliocene Research, Interpretation, and Synoptic Mapping) Modern FEB_SST/VEG Marine Localities Modern FEB_SST/VEG Pliocene FEB_SST/VEG Pliocene FEB_SST/VEG Terrestrial Localities
Pliocene Research, Interpretation and Synoptic Mapping Feb SST Aug SST Elevation Land Cover Sea Ice
DEC DEC JAN SST JAN SEA-ICE The PRISM2 reconstruction consists of 27 global scale data sets on a 2°latitude by 2° longitude grid. It is the most complete and detailed global reconstruction of climate and environmental conditions older than the last glacial. PRISM2 Data Set TOPO- GRAPHY SEA LEVEL VEG
CAUSE EFFECT Past Climate Change: Observed Results Unknown Forcings
Pliocene Sea Surface Temperature Anomaly(January) ∆T = +2.09°C
Change in Surface Air Temperature(Annual Average) ∆T = +2.2°C
3 Mya 2005
Pliocene Temperature Change: 3 MYA +2.13 °C 2050s +2.33 °C
3 Myr 2050s
DAI Hansen, 2004
Could it happen again? If the oceans respond in a manner similar to the mid-Pliocene warming then estimates of global warming would be altered significantly in some regions.
D Temperature from 1958-80 Mean Latitude CO2 Increase + 0.8 OHT CO2 Increase + 1 OHT Latitude CO2 Increase + 1.2 OHT Latitude
Has it happened before? The warming of the 1930s was more similar to a warming caused by altered ocean heat transports than to greenhouse gas increases. 5-Year Running Mean 90N 3.0 60N 1.4 0.7 30N 0.3 0.1 °C 0.0 0 EQ -0.1 -0.3 30S -0.7 -1.4 60S -3.0 90S 1880 1895 1910 1925 1940 1955 1970 1985 Year
Precipitation - Evaporation (Modern) Minimum - Average
Atlantic 40°-60° N Modern Control Run Southern Ocn 48°-72° S 16% decrease in peak North Atlantic overturning Pliocene Surface Boundary Conditions Only
Phase 1 Atlantic Ocean Study Interval
Atlantic 40°-60° N Pliocene PRISM Ave. SST with Deep Ocean Temperatures Southern Ocn 48°-72° S Near modern peak North Atlantic overturning Pliocene PRISM Max SST with Deep Ocean Temperatures
Summary Comments • The mid-Pliocene climate was as warm as the Earth will be within the next few decades. • Significant peak-to-peak variability in the mid- Pliocene means sea ice and ice-sheet reconstructions could represent a maximum warm climate state. • Pliocene paleogeography alone can drive significant changes in ocean circulation but, by itself, cannot generate an ocean consistent with paleo-data. • Even Pliocene coupled-OA model simulations initiated by paleo-SST forcing cannot reproduce paleoceanographic circulation. However, the addition of DOT data improves the simulations. • Paleo-DOT provides a means of initiating coupled model paleoclimate simulations that is more similar to modern control runs and should improve model/data consistency.