Download
1 / 9

E N D
Misleading Graphs • Good graphs are extremely powerful tools for displaying large quantities of complex data; they help turn the realms of information available today into knowledge. But, unfortunately, some graphs deceive or mislead. This may happen because the designer chooses to give readers the impression of better performance or results than is actually the situation. In other cases, the person who prepares the graph may want to be accurate and honest, but may mislead the reader by a poor choice of a graph form or poor graph construction.
The following things are important to consider when looking at a graph: 1. Title 2. Labels on both axes of a line or bar chart and on all sections of a pie chart 3. Source of the data 4. Key to a pictograph 5. Uniform size of a symbol in a pictograph 6. Scale: Does it start with zero? If not, is there a break shown 7. Scale: Are the numbers equally spaced?
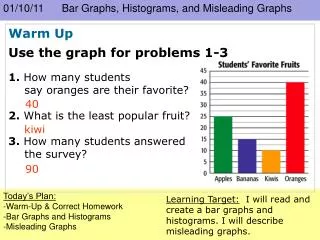
Here are some examples of misleading graphs. Can you see what is wrong with each of them? Make a list of their faults. The bar chart indicates that house prices have tripled in one year. The scale of vertical must start at 0 and that’s not the case. Let’s look at a less misleading graph.
Look at the 'improved' version of the same graph. This gives a much more accurate picture of what has happened. House prices
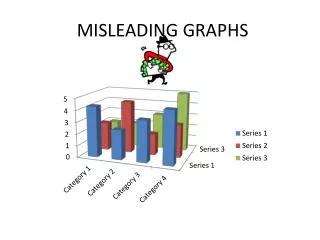
What is wrong with the information represented on this graph? Although the vertical scale starts at 0, it does not go up in even steps. This distorts the graph, and makes it look as though the biggest jump is between 1 and 2 rather than 3 and 4. Also, there are no labels on the axes so we have no idea what this graph represents!
A better graph It is better but not quite. What does it still need?
What’s wrong? On this Pictogram there isn't a category for those people who do not own a pet. The pictures are different sizes and it appears that more people own a horse than any other animal. An improvement would be to redraw the pictogram with each of the animals the same size and aligned with one another.
The sizes are better but we still need a “no pet” category and a title.