Download
1 / 15
160 likes | 286 Views
MISLEADING GRAPHS. Misleading graphs. It is a well known fact that statistics can be misleading. They are often used to prove a point, and can easily be twisted in favor of that point!. Here are some examples of misleading graphs. Can you see what is wrong with each of them?.

E N D
Misleading graphs It is a well known fact that statistics can be misleading. They are often used to prove a point, and can easily be twisted in favor of that point!
Here are some examples of misleading graphs. Can you see what is wrong with each of them?
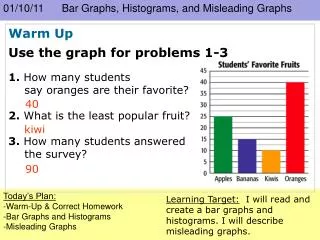
What is wrong with this bar chart? How should the information be represented?
From this graph it looks as though house prices have tripled in one year! It is misleading because the vertical axis does not start at 0.
Look at the 'improved' version of the same graph. This gives a much more accurate picture of what has happened.
What is wrong with the information represented on this graph?
What is wrong with the information represented on this graph? • Although the vertical scale starts at 0, it does not go up in even steps. This distorts the graph, and makes it look as though the biggest jump is between 0 and 1 rather than 2 and 3. • Also, there are no labels on the axes so we have no idea what this graph represents!
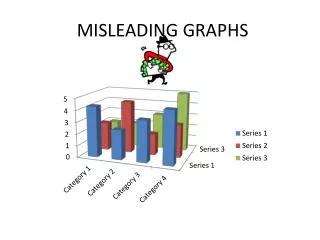
What is wrong with this 3D bar chart? This 3D bar chart might look very attractive, but it is also very misleading. There is no scale on the vertical axis, and because of the perspective it looks as though the sales for 1999 were far greater than those for any other year. In fact they were identical to those for 1996.
It would be much better to draw a chart like this with the appropriate labeling on each axis:
What is wrong with this pictogram showing the number of people who own different types of pets?
On this pictogram there isn't a category for those people who do not own a pet. The pictures are different sizes and it appears that more people own a horse than any other animal.
An improvement would be to redraw the pictogram with each of the animals the same size and aligned with one another like this: