Download
1 / 27
270 likes | 408 Views
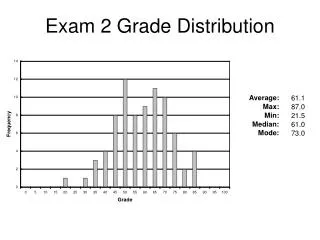
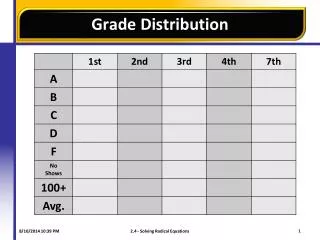
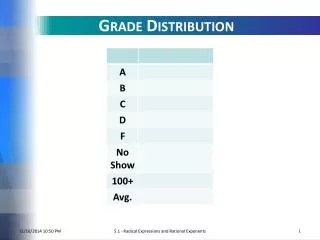
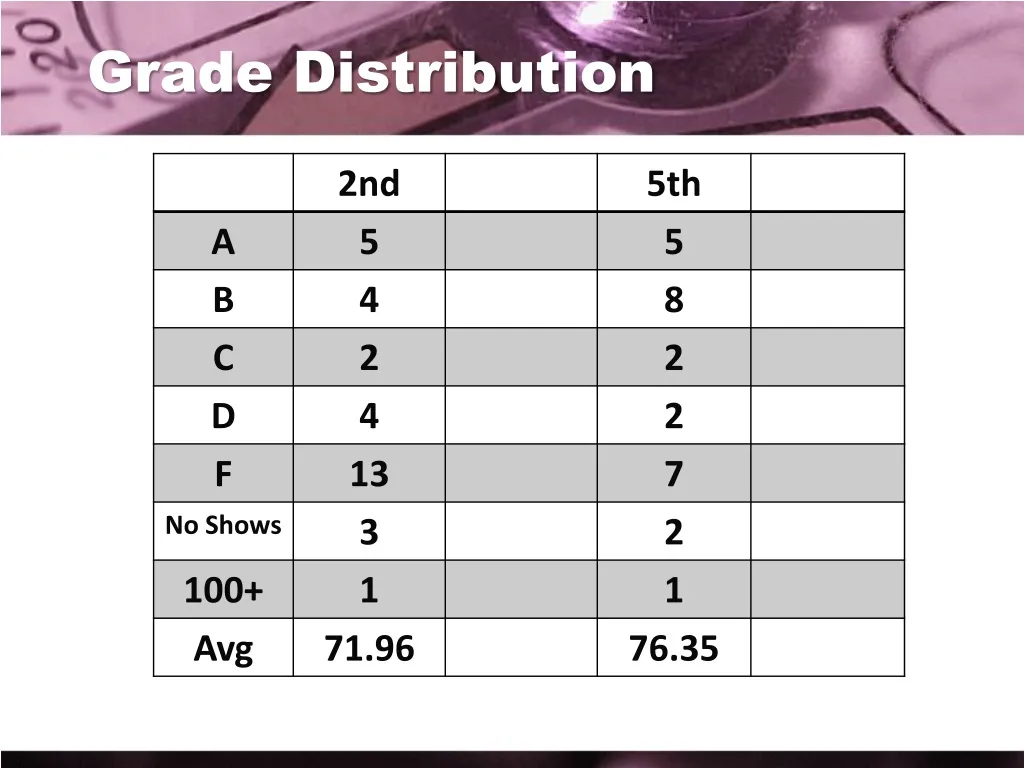
Grade Distribution. Using Graphs and Tables to Solve Linear Systems. S E C T I O N 3 . 1. Definitions. Systems of Linear Equations Requires 2 variables into two linear standard form equations Solutions are systems of ordered pairs ( x , y ). Example 1.

E N D
Using Graphs and Tables to Solve Linear Systems S E C T I O N 3 . 1 3-1: Solving Linear Equations through Graphing and Tables
Definitions • Systems of Linear Equations • Requires 2 variables into two linear standard form equations • Solutions are systems of ordered pairs (x, y) 3-1: Solving Linear Equations through Graphing and Tables
Example 1 Is (1, 3) a solution to the system, Plug the coordinates into the system,. YES 3-1: Solving Linear Equations through Graphing and Tables
Your Turn Is (–1, 6) a solution to the system, Plug the coordinates into the system,. NO 3-1: Solving Linear Equations through Graphing and Tables
Steps when graphing • Graph both equations (preferably on y-intersect form) • Determine what the intersecting point is and put it in coordinate form • Check your point to both equations 3-1: Solving Linear Equations through Graphing and Tables
Example 2 Graph these equations and determine the intersection points for this system, Start out with the first equation and put it in y= form 3-1: Solving Linear Equations through Graphing and Tables
Example 2 Graph these equations and determine the intersection points for this system, Find out the second equation and put it in y= form 3-1: Solving Linear Equations through Graphing and Tables
Example 2 Graph these equations (4, 4) 3-1: Solving Linear Equations through Graphing and Tables
Example 2 Check to see if (4, 4) is the accurate solution to the system,… 3-1: Solving Linear Equations through Graphing and Tables
Example 3 Graph these equations and determine the intersection points for this system, Start out with the first equation and put it in y= form 3-1: Solving Linear Equations through Graphing and Tables
Example 3 Graph these equations and determine the intersection points for this system, Find out the second equation and put it in y= form 3-1: Solving Linear Equations through Graphing and Tables
Example 3 Graph these equations (1, 3) 3-1: Solving Linear Equations through Graphing and Tables
Example 3 Check to see if (1, 3) is the accurate solution to the system,… 3-1: Solving Linear Equations through Graphing and Tables
Your Turn Graph these equations and determine the intersection points for this system, (3, –1) 3-1: Solving Linear Equations through Graphing and Tables
Using Graphing Calculator Graph these equations and determine the intersection points for this system, Must be in Y= Form 3-1: Solving Linear Equations through Graphing and Tables
Using Graphing Calculator Graph these equations and determine the intersection points for this system, 2nd TRACE 5 ENTER ENTER ENTER 3-1: Solving Linear Equations through Graphing and Tables
Types of Solutions • Put the equations into slope-intercept form • Determine the equation by looking the slope of the system • Determine the solution • Consistent Solution:A system, that has at least ONEsolution • Inconsistent Solution:A system, that has NOsolution • Independent Solution:A system, that has EXACTLY one solution • Dependent Solution:A system, that has INFINITE amount of solutions 3-1: Solving Linear Equations through Graphing and Tables
Types of Solutions 3-1: Solving Linear Equations through Graphing and Tables
Flowchart How many solutions does it have? INCONSISTENT (No Solution) CONSISTENT (At least 1 Solution) How many points do they intersect? All points (overlap) 1 point DEPENDENT INDEPENDENT 3-1: Solving Linear Equations through Graphing and Tables
Example 4 Graph these equations and determine the intersection points for this system, Start out with putting both equations into slope-intercept form 3-1: Solving Linear Equations through Graphing and Tables
Example 4 Graph these equations and determine the intersection points for this system, The system, is consistent and dependent with infinitely many solutions. 3-1: Solving Linear Equations through Graphing and Tables
Your Turn Graph these equations and determine the intersection points for this system, The system, is inconsistent and has no solution. 3-1: Solving Linear Equations through Graphing and Tables
Example 5 City Park Golf Course charges $20 to rent golf clubs plus $55 per hour for golf cart rental. Sea Vista Golf Course charges $35 to rent clubs plus $45 per hour to rent a cart. For what number of hours is the cost of renting clubs and a cart the same for each course? 3-1: Solving Linear Equations through Graphing and Tables
Example 5 Let x represent the number of hours and y represent the total cost in dollars. City Park Golf Course: y = 55x + 20 Sea Vista Golf Course: y = 45x + 35 3-1: Solving Linear Equations through Graphing and Tables
Example 5 Use increments of ½ to represent 30 min. y = 55x + 20 y = 45x + 35 When x = 1 1/2, the y-values are both 102.5. The cost of renting clubs and renting a cart for 1 1/2 hours is $102.50 at either company. So the cost is the same at each golf course for 1 1/2 hours. 3-1: Solving Linear Equations through Graphing and Tables
Assignment Pg 156 15-29 odd, 35 3-1: Solving Linear Equations through Graphing and Tables