Download
1 / 52
520 likes | 688 Views
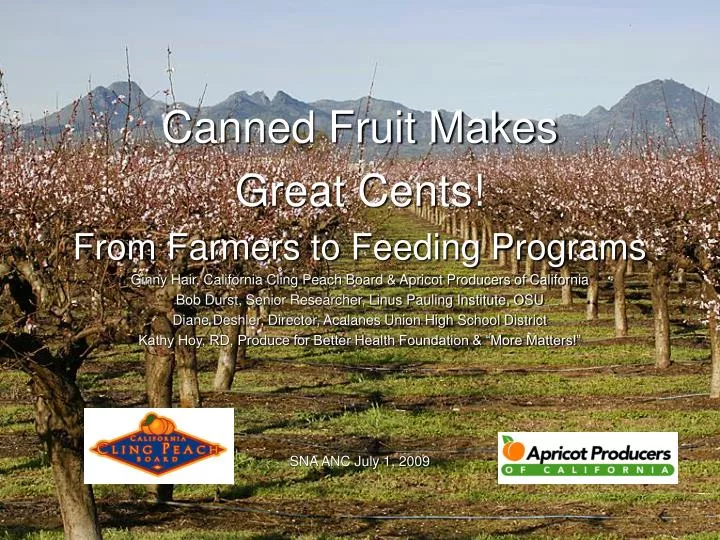
Canned Fruit Makes Great Cents! From Farmers to Feeding Programs Ginny Hair, California Cling Peach Board & Apricot Producers of California Bob Durst, Senior Researcher, Linus Pauling Institute, OSU Diane Deshler, Director, Acalanes Union High School District

E N D
Canned Fruit Makes Great Cents! From Farmers to Feeding Programs Ginny Hair, California Cling Peach Board & Apricot Producers of California Bob Durst, Senior Researcher, Linus Pauling Institute, OSU Diane Deshler, Director, Acalanes Union High School District Kathy Hoy, RD, Produce for Better Health Foundation & “More Matters!” SNA ANC July 1, 2009
Introductions & Overview • Ginny Hair, California Cling Peach Board & Apricot Producers of California • Bob Durst, Senior Researcher, Linus Pauling Institute, OSU • Diane Deshler, Director, Acalanes Union High School District • Kathy Hoy, RD, Produce for Better Health Foundation & “More Matters” programs
Introductions & Overview • Rajeev Davit, Chairman, Advertising and Promotion Committee, CCPB • Richard Lial, Grower; Justin Micheli, Grower; Joe Dickens, Grower • Bill Ferriera, President of the Apricot Producers of CA • Rich Hudgins, President of the California Canning Peach Association • Kathy Sheldon, Seneca Foods
Canned Fruit: Yesterday and… Today! Why Canned Fruit Makes Sense Now! • Affordable • Versatile • Safe & Shelf Stable • Kids Love It! • Nutritious
Canned and Frozen Cling Peach Study Bob Durst Linus Pauling Institute Bob.Durst@OregonState.edu
Linus Pauling Institute Mission Statement • Determine the function and role of vitamins and essential minerals (micronutrients) and chemicals from plants (phytochemicals) in promoting optimum health and preventing or treating disease. • Determine the role of oxidative stress and inflammation in human health and disease, and the protective effects of dietary factors with anti-oxidant or anti-inflammatory properties. • Help people everywhere achieve a healthy and productive life, full of vitality, with minimal suffering, and free of cancer and other debilitating diseases.
LPI Prescription for Health • Healthy Eating • 5 servings Fruits and Vegetables (9 is better) • Increase Omega-3 fatty acids • Reduce saturated and trans-fat • Avoid soft drinks, sugar-coated cereal, candy • Healthy Lifestyle • Healthy bodyweight • 30 minutes moderate, daily exercise • Supplements • Multi-vitamins, C, D, E, calcium
Fruits & Vegetables • Vitamins • Essential Minerals • Fiber • Phytochemicals • Flavonoids/Polyphenols • Carotenoids • Chlorophyll • Etc.
Peach Storage Study • California Cling Peach Board • Nutrient content of peach products • How do processed peaches compare to fresh? • How does processing impact nutrients? • How does storage affect nutrients? • Promote healthy aspect of canned peaches
Peach Samples • Canned in syrup (CS) • Canned in (pear) juice (CJ) • Frozen (Frzn) • Fresh (Fresh) • Storage Time • 0, 3, 6 and 12 months • Fresh samples 2007 & 2008
Analytes for 2009 • Vitamin E • Carotenoids (Vitamin A) • Phenolics • Profile • Total (F-C) • Antioxidants • Vitamin C • FRAP • Sugars • Fiber
Vitamin E for 2009 • Processing increases levels • Canned in juice 2x higher • Canned in syrup 3x higher • Frozen 4x higher • Retention during storage • Canned in juice retained 67% • Canned in syrup retained 50% • Frozen retained 73% • 4-17% RDA (fresh 2-5%)
Carotenoids (Vitamin A) for 2009 • Processing increases levels • Canned in juice 7x higher • Canned in syrup 6.5x higher • Frozen 10x higher • Retention during storage • Canned in juice retained 64% • Canned in syrup retained 75% • Frozen retained 65% • 6-20% RDA (fresh 1%)
Phenolics No scientific proof that flavonoids exert physiologically relevant antioxidant effects in humans! Good scientific evidence that flavonoids exert (non-antioxidant) physiological effects, and have possible health benefits, in humans!
Phenolics in Peaches • Phenolic fingerprint • Dozens of unique compounds • Changes with processing • Changes in profile and Increase in amounts • Minor changes with storage • Total phenolics • Frozen is highest (?Vit C interference) • No changes with storage
Canned in Juice (t12) Fresh Freestone 40.0 35.0 30.0 25.0 mAU 20.0 15.0 10.0 5.0 0 0 5.0 10.0 15.0 20.0 25.0 30.0 35.0 40.0 Minutes
Vitamin C for 2009 • Retention during storage • CJ samples after 12 months storage retain over 70% • CS samples had 106% • Frozen sample had 90% • Difference between canned & frozen • Frozen samples had added ascorbic acid (and citric acid) • Significant addition compared to what's naturally present • Fresh had higher levels than processed • Losses occurred during canning process • Little change during storage • 15-40% RDA (fresh 35-75%) (frozen 5-10x)
Frozen Canned in juice Canned in syrup Fresh
Antioxidants (FRAP) for 2009 • Range of values measured is quite large • No change during storage in canned samples • CS is 24% greater than CJ • Frozen samples significantly greater • Due to added ascorbic acid • >50% loss during storage • Not fully accounted for by decrease in ascorbic
Frozen Fresh Canned in syrup Canned in juice
Conclusions • Processing Preserves and Increases Nutrients! • Canned peaches are sources of (/100g) • Vitamin C • 15-40% RDA (fresh 35-75%) (frozen 5-10x) • Antioxidants • No RDA • Carotenoids (Vitamin A) • 6-20% RDA (fresh 1%); Canned in syrup 6.5x higher! • Vitamin E • 4-17% RDA (fresh 2-5%)
A Director’s Perspective Why Canned Fruit Makes Great Cents (Now More Than Ever!) Locally Grown! Why Research is Important to Canned Fruit Innovating with Canned Fruit Audience to Fill Out Tip Sheet
Locally Grown • California Canned Apricots • California Cling Peaches • California Pears • Northwest Pears • Generation-Old Family Farms • Stewards of Our Lands • Committed to Sustainability • Committed to Our Schools & Kids Gene Bays Sarb Johl
Why The OSU Research Is Important! • Supports what we know as directors! • Supports the increased consumption of fruits and vegetables in all forms – canned, frozen, dried and fresh • Reinforces USDA dietary guidelines • Echoes what nutritionists & RDs tell us, “any fruit is a good fruit.” • Supports existing studies regarding canned and frozen nutritional values • Allows programs to maintain flexibility • Proves nutritional value over time – “Picked at peak of ripeness” • Provides cost savings, convenience, food safety & NUTRITION!
Innovating with Canned Fruit! • Fruit is the New Dessert! • Mix Commodity Fruits Together • California Orchard Salad Bars • Power Parfaits • Breakfast Bars
Most moms continue to believe that their families eat too little fruit and vegetables The family’s consumption of VEGETABLES The family’s consumption of FRUIT 2006 (n = 550) 2006 (n = 550) % Respondents % Respondents 2009 (n = 1000) 2009 (n = 1000) 2008 (n = 1000) 2008 (n = 1000) 2007 (n = 1000) 2007 (n = 1000) Q19. Which of these statements best represents your family’s eating habits for each of the following? (Include fresh, canned, frozen, dried, and 100% juice)
Most moms intend to include more fruit and vegetables in the next 3 to 6 months I plan to include more fruits and vegetables in the next: % Respondents Q46: Realistically, I plan to include more fruits and vegetables in my family’s meals and snacks in the next: Q47: What is one way that you plan to include more?
Canned fruit is ideal for increasing consumption • All forms count • Variety • Convenience • Consistent quality • Affordable • Shelf stable
Moms feel they have less support this year Please rate your level of agreement or disagreement with the following statements… Agree Disagree Net Scores *Not asked in 2007 2009 % Respondents (Bottom 2 Box) 2008 2007 % Respondents (Top 2 Box) Q44. Please rate your level of agreement or disagreement with the following statements.
Moms finding it harder to get their family to eat fruit and vegetables during all occasions How easy is it for you to get your family to eat fruit and vegetables at different times throughout the day? FRUIT VEGETABLES 2009 (n = 1000) 2009 (n = 1000) 2008 (n = 1000) 2008 (n = 1000) 2007 (n = 1000) 2007 (n = 1000) % Respondents (Easy) % Respondents (Easy) *Not included as an option in 2007 Q49. How easy is it for you to get your family to eat VEGETABLES at the following times? Q50. Please rate how easy it is to get your family to eat FRUIT at the following times?
INFORMATION: Frozen and dried fruit & vegetables are perceived to be less healthy this year while fruit-based snacks & fruit flavoring less unhealthy In general, how healthy do you consider the following foods to be? Not Healthy Healthy Net Scores % Respondents (Bottom 2 Box) 2009 2008 2007 2006 % Respondents (Top 2 Box) Q13. In general, how healthy do you consider the following foods to be?
Less popular types gaining in availability in the home How available are fruit and vegetables in your home? FRUIT VEGETABLES 2009 (n = 1000) 2009 (n = 1000) 2008 (n = 1000) 2008 (n = 1000) 2007 (n = 1000) 2007 (n = 1000) % Respondents (Available) % Respondents (Available) Q23. Please rate the availability of fruit and vegetables in your home.
Convenience and shelf-life are key drivers of non-fresh fruit and vegetables Why do you purchase ...? (only asked if the product is available in the home) % Respondents Q24: Why do you purchase frozen fruits? (Please select all that apply) Q27: Why do you purchase canned fruits? Please select all that apply) Q32: Why do you purchase frozen vegetables? (Please select all that apply) Q35: Why do you purchase canned vegetables? (Please select all that apply)
Uses for Fruit and Vegetables How do you use...? (only asked if the product is available in the home) % Respondents Empty boxes indicate the category was not presented to the respondent Q25: How do you use frozen fruits? (Please select all that apply) Q28: How do you use canned fruits? (Please select all that apply) Q30: How do you use dried fruits? (Please select all that apply) Q33: How do you use frozen vegetables? (Please select all that apply) Q36: How do you use canned vegetables? (Please select all that apply)
Non-fresh fruit & vegetables are primarily not purchased due to dislike Why are they not available? (only asked if the product is not available in the home) % Respondents Q26: What reasons best describe why frozen fruits are not usually available in your home? (Please select all that apply) Q29: What reasons best describe why canned fruits are not usually available in your home? (Please select all that apply) Q31: What reasons best describe why dried fruits are not usually available in your home? (Please select all that apply) Q34: What reasons best describe why frozen vegetables are not usually available in your home? (Please select all that apply) Q37: What reasons best describe why canned vegetables are not usually available in your home (Please select all that apply)
Fresh fruit is the most likely to be purchased more than once a week for 2009 % Respondents (n=1000) Q38: How many times per week do you go to the store to purchase the following:
Using Canned Fruit At meals: On hot or cold cereal Topping for pancakes or waffles In yogurt or cottage cheese Added to salads Smoothies In lunch box Side dish
Using Canned Fruit Snacks/Appetizers Salsa Fruit tray Fruit Kebobs Frozen Fruit Soup Dessert Top with pudding, tapioca or ice cream Grilled Use in cobblers, pies, etc. As Is
What This Means for Kids • Better nutrition • Healthy eating habits • More variety and interest • Tastes Great!
What This Means For Schools • Opportunity to meet School Breakfast and Lunch standards inexpensively and easily • Promote healthful eating • Versatility for menu planning • Less plate waste