Download
1 / 10
100 likes | 173 Views
MOS - Spreadsheets. CTE – IT Performance Task Spring, 2014. Overview.

E N D
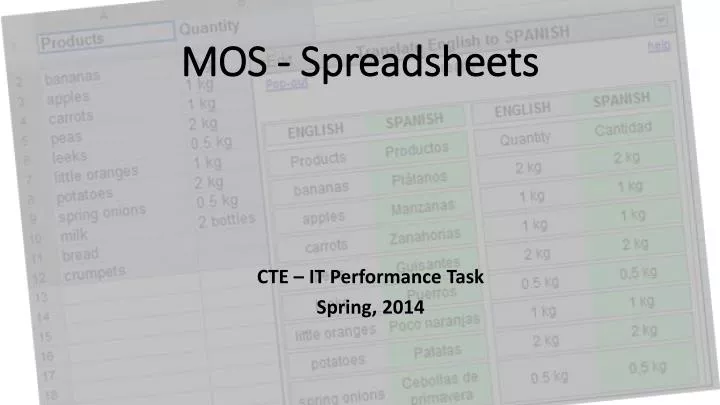
MOS - Spreadsheets CTE – IT Performance Task Spring, 2014
Overview In this performance task, you will demonstrate your knowledge of functions and formulas using spreadsheet software according to the handout provided. You will also interpret visual data through charts. After completing the handout you will use computers to demonstrate your basic knowledge of Excel.
Scenario #1 Someone has just opened a donut business in your neighborhood and needs your help. The owner would like for you to tell him how he can use a spreadsheet program to help him with his business.
Question #1: Describe 3 ways a spreadsheet program can help your neighbor with his business. 1. 2. 3.
Question #2: List 3 functions you would use to help your neighbor with his finances. 1. 2. 3.
Your neighbor has created the following spreadsheet (Figure 1).
He is trying to calculate the average sales for March 1st and March 2nd. • One formula has multiple errors and does not calculate the average sales. • Which formula does NOT accurately express average sales calculations in cells B5 and C5? • Write the formula that you believe has the error in the box below.
Describe ALL of the errors in the formula that your brother made in the box below.
Question #3: Use Excel to Insert a Chart in a Worksheet. 1) Open Microsoft Excel 2007/2010. 2) Create a chart that displays the sales for March 1st. Your chart should look like exactly Figure-2. 3) Once your chart is created, save the workbook with the name ECSEXCEL. 4) Submit via email for grading before the assessment (spking@cps.edu).
Note: Your slide must look exactly like the one above in order for you to gain points. How can you do this?