Download
1 / 17
170 likes | 311 Views
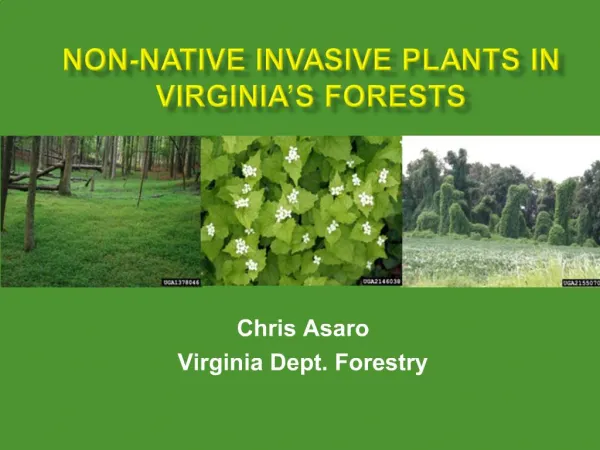
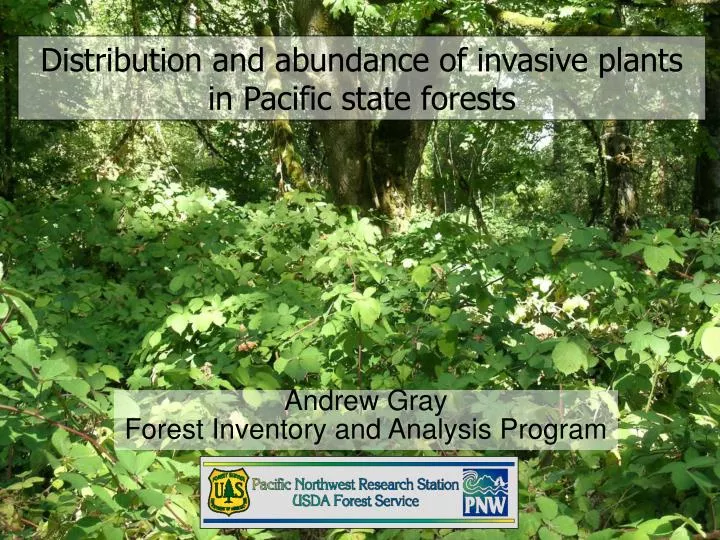
Distribution and abundance of invasive plants in Pacific state forests. Andrew Gray Forest Inventory and Analysis Program. The Problem. Nonnative invasive plants cost the U.S. at least $35 billion/yr in lost land use and weed control *

E N D
Distribution and abundance of invasive plants in Pacific state forests Andrew Gray Forest Inventory and Analysis Program
The Problem • Nonnative invasive plants cost the U.S. at least $35 billion/yr in lost land use and weed control * • Comprehensive information about the abundance and impact of invasive plants is not available: • How much land area is affected? (C+I, Heinz Ctr) • Which species are most abundant? • Most invasive plant “monitoring” done by agencies has limited utility • * Source: Pimentel et al. 2005. Ecological Economics 52: 273-288 • based primarily on ag and pasture land, not range, forest, wetland
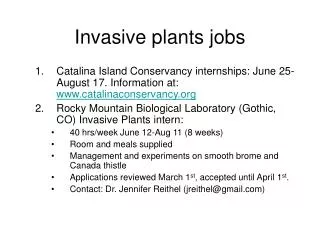
The Approach • Evaluate invasive plant impacts on a statistically-based sample of forest lands • Options: • Complete sample of all species • Targeted sample of species of concern (list)
Forested FIA plots sampled 2001-2005 Intensive plots (P3) n=201 (N=1,018) Standard plots (P2) n=7,558 (N=16,752)
Constraints for FIA sampling of understory plants • Identifying all those plants requires expertise (3,400 vascular species in OR alone) • You have to get there when the plants are identifiable (summer)
FIA plot(standard, with intensive plot quadrats) Intensive: all species Standard: most abundant (+ identifiable) Frequency points: quadrat=3 subplot=1 1 m2 quadrats 7.3 m radius subplot 0.017 ha/subplot x4 = 0.068 ha 36.6 m (120’) between subplot centers
Nonnative importance across OR+WA Area covered by nonnatives:
Modeling distribution of well-represented species on standard grid
Invasive lists • What’s an invasive? • Criteria range from economic (ag), conservation of rare ecosystems, politics • Usually not specific to forests • Coastal state list compilation • 421 species total • 245 guesstimated to occur on forestland • 95 widely distributed and invasive (primarily graminoids and composites) • Finalizing the list for inventory • limited list size (30-40 spp “doable”) • emerging threats not efficient on FIA grid • compatible species (slow phenology, easy to ID)= emphasis on woody plants
Carrying capacity Control priority stage Quarantine priority stage Effective control unlikely without massive resource inputs Invader abundance Eradication priority stage Invasion Time Fit the monitoring to the question
Conclusions 1 • Nonnative species are already well-established in Pacific state forests, and are currently most abundant in early seral, non-federal lands. • What about non-forest? NRI samples ag lands; “Range pilot” in 2007 with NRI and FIA to refine design and protocols: invasives and full-species composition are key elements.
Conclusions 2 • Representative estimates from probability-based sampling of invasive plant impacts provides needed information to policy-makers and managers. • List-based sampling on standard plots can provide detailed information on selected species. • However, an all-species sample (P3) is needed to calculate the metrics used in national assessments (Heinz ctr, Criteria + Indicators)