Download
1 / 71
710 likes | 1.07k Views
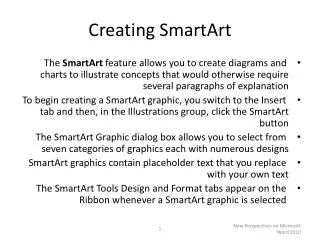
Creating SmartArt Graphics. Lesson 7. Objectives. Software Orientation. PowerPoint 2010 offers eight different types of SmartArt diagrams, with many layouts for each type. The figure below shows the dialog box that appears when you choose to insert a SmartArt diagram . Software Orientation.

E N D
Creating SmartArt Graphics Lesson 7
Software Orientation • PowerPoint 2010 offers eight different types of SmartArt diagrams, with many layouts for each type. The figure below shows the dialog box that appears when you choose to insert a SmartArt diagram.
Software Orientation • When you click a layout, the right pane of the dialog box shows you a close-up view of the selected layout and provides information on how to use the layout. This description can help you decide whether the layout will be appropriate for your information.
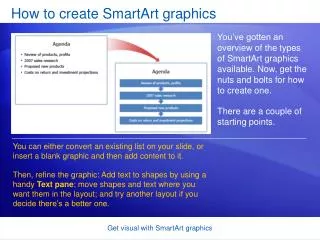
Adding SmartArt to a Slide • Use the Insert SmartArt Graphic icon in any content placeholder to start a new diagram. • After you have selected a type and a layout, you can add text to the diagram. • PowerPoint also lets you use existing bullet items to create a SmartArt diagram.
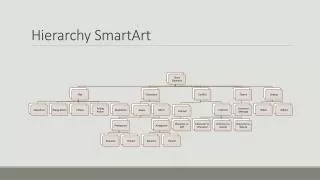
Inserting a SmartArt Graphic • SmartArt diagrams (also called SmartArt graphics) are visual representations of information you want to communicate. • SmartArt diagrams show items of related information in a graphical way that makes their relationships easy to understand. • You can use SmartArt diagrams to present text information in a more visually interesting way than the usual bulleted or numbered formats. • An organization chart is a type of diagram that shows the relationships among personnel or departments in an organization. Organization charts are included in the Hierarchy type SmartArt layouts. • In this exercise, you insert a SmartArt graphic diagram.
Step-by-Step: Insert an Organization Chart SmartArt Graphic • Before you begin these steps, make sure that your computer is on. Log on, if necessary. • STARTPowerPoint, if the program is not already running. • Locate and open the Litware presentation and save it as Litware Final. • Go to slide 3, and click the Insert SmartArt Graphic icon in the center of the content placeholder. The Choose a SmartArt Graphic dialog box opens. • Click Hierarchy in the type list in the left side of the dialog box. The layouts for the Hierarchy type are displayed.
Step-by-Step: Insert an Organization Chart SmartArt Graphic • Click the first layout in the first row, the Organization Chart. Read the description of the Organization Chart layout in the right pane of the dialog box. See the figure below.
Step-by-Step: Insert an Organization Chart SmartArt Graphic • Click OK to insert the diagram. The diagram appears on the slide, as shown at right. • SAVEthe presentation. • LEAVE the presentation open to use in the next exercise.
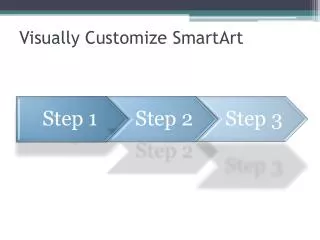
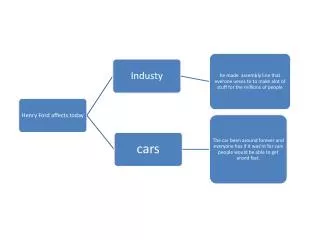
Step-by-Step: Insert an Organization Chart SmartArt Graphic • The Choose a SmartArt Graphic dialog box sorts its many layouts by types such as List, Process, Hierarchy, and so on. A SmartArt layout is a particular arrangement of shapes that a diagram can have. The following general descriptions of SmartArt types can help you choose a type and a specific layout within that type: • Use the List layouts to display information that does not have to be in a particular order, such as a list of items to purchase. • Use the Process layouts to show the steps in a process or timeline, such as the steps in a manufacturing process. • Cycle layouts are useful for showing a repeating process, such as a teaching cycle of preparing for a semester, teaching a class, and submitting grades.
Step-by-Step: Insert an Organization Chart SmartArt Graphic • Hierarchylayouts show levels of subordination, such as in an organization chart or a tournament bracket. • Use Relationship layouts to show connections among items, such as the relationship between supply and demand. • Matrix layouts show how parts relate to a whole, similar to a pie chart. • Pyramid layouts display relationships in terms of proportion, from largest at the bottom to smallest at the top. • Picture layouts include placeholders for one or more graphics in addition to the text placeholders. • More layouts can also be found at Office.com. Click the Office.com category to see what’s available. • Some layouts appear in more than one type’s listing. For example, most of the Picture layouts are also categorized as other types.
Adding Text to a SmartArt Diagram • A new SmartArt diagram appears on the slide with empty shapes to which you add text (and in some cases, pictures) to create the final diagram. • The appearance and position of these shapes are guided by the layout you chose, and shape color is controlled by the current theme. As you enter text in the diagram, PowerPoint resizes the shapes to accommodate the longest line of text in the diagram. Font size is also adjusted for the best fit, and PowerPoint keeps the font size the same for all shapes. • In this exercise, you learn how to add text to the SmartArt diagram organizational chart you have inserted in your PowerPoint slide.
Adding Text to a SmartArt Diagram • An organization chart, such as the one you create in this section, has some special terminology and layout requirements. • In an organization chart, there can be only one top-level shape, which is typically occupied by the name of the person or department at the head of the organization. • Persons or departments who report to the top-level entity are subordinates. • An assistant is a person who reports directly to a staff member and usually appears on a separate level.
Step-by-Step: Add Text to a SmartArt Diagram • USEthe Litware Finalpresentation that is still open from the previous exercise. • If the text pane is not already open, click the Text Panearrows on the left side of the SmartArt object frame (refer to slide 9). This opens the Text pane. • Click next to the bullet at the top of the Text pane to place the insertion point there. Type Ted Hicks to enter the name in the top-level shape of the diagram. Notice that as you type the text in the Text pane, it appears in the top shape of the diagram, as shown in the figure on he next slide, and that the text automatically resizes to fit in the shape.
Step-by-Step: Add Text to a SmartArt Diagram • Click in the bullet item below Ted Hicksin the Text pane, then type Rose Lang. Rose Lang is an assist-ant to Ted Hicks, and as such, she has an assistant shape on a level between the top-level shape and the subordinate shapes. • Click in the next bullet item in the Text pane and type Marcus Short. Marcus Short is a subordinate to Ted Hicks.
Step-by-Step: Add Text to a SmartArt Diagram • Click in the next bullet item and type Ellen Camp. • Click in the last bullet item and type Pat Cramer. • Click the Close button (X) in the Text pane to hide it. You will complete the text entry by typing directly in the diagram’s shapes. • Click just to the right of the name Hicks in the top-level shape, press Enter, and type Director. Notice that the text size adjusts in all the shapes to account for the additional entry in the top-level shape. • Click after the name Lang in the assistant shape, press Enter, and type Assistant Director.
Step-by-Step: Add Text to a SmartArt Diagram • Use the same process to type the title Reading Products for Marcus Short, Linguistics Products for Ellen Camp, and Writing Products for Pat Cramer. • Click away from the SmartArt to deselect it. Your slide should look similar to the figure at right. • SAVEthe presentation. • LEAVE the presentation open to use in the next exercise.
Step-by-Step: Add Text to a SmartArt Diagram • Text in a diagram appears either within a shape or as a bulleted list, depending on the diagram type and layout option. In the previous exercise, you inserted text only in shapes, because an organization chart does not offer the option of bulleted text. The figure at right shows a list type diagram that contains both shape text and bulleted text.
Step-by-Step: Add Text to a SmartArt Diagram • You can display or hide the Text pane, which is the panel to the left of a new diagram in which you can type diagram text. In the Text pane, shape text (that is, text that appears in shapes) appears as the top-level bullet items and text that appears on the diagram in bulleted text format is indented below the shape text, similar to the way several levels of bulleted text appear in a content placeholder. • You can use the Text pane to enter text, or you can enter text directly in each shape. Click next to a bullet in the Text pane or click any [Text] placeholder and begin typing text. If you need more bullet items than are supplied in the default layout, press Enter at the end of the current bullet item to add a new one, or click the Add Bullet button in the Create Graphic group on the SmartArt Tools Design tab.
Step-by-Step: Add Text to a SmartArt Diagram • If you don’t want to use the Text pane, you can close it to get it out of the way. To redisplay it, click the Text Pane button on the left border of the SmartArt container, or click the Text Pane button in the Create Graphic group on the SmartArt Tools Design tab. You can also right-click anywhere in the diagram and then click Show Text Pane on the shortcut menu.
Converting Text or WordArt to a SmartArt Diagram • As you work with slide text, you may realize that the information would work well as a SmartArt diagram. In this situation, you do not have to retype the text in the SmartArt diagram shapes. Simply convert the bulleted list to a diagram. • You can create a diagram from any bulleted list on a slide or any WordArt object. You can choose one of the common diagrams in the Convert to SmartArt gallery, or you can access the Choose a SmartArt Diagram dialog box to choose any diagram type or layout. • In this exercise, you learn how to convert a list into a SmartArt Cycle diagram, and you convert WordArt text into a single SmartArt object.
Step-by-Step: Convert Text or WordArt to a SmartArt Diagram • USEthe Litware Finalpresentation that is still open from the previous exercise. • Go to slide 4 and select the bulleted list. • Click the Home tab, if necessary, and then click the Convert to SmartArt button in the Paragraphgroup. PowerPoint displays the gallery shown at right. • Click More SmartArt Graphics at the bottom of the gallery. The Choose a SmartArt Graphic dialog box opens.
Step-by-Step: Convert Text or WordArt to a SmartArt Diagram • Click Cycle, then click the Block Cycle layout. Read the description of how best to use the Block Cycle layout. • Click OK. The bulleted list is converted to a cycle diagram, as shown at right. • Go to slide 1, and triple-click the Developer Orientation WordArt object to select it.
Step-by-Step: Convert Text or WordArt to a SmartArt Diagram • On the Home tab, click Convert to SmartArt, then click VerticalBullet List (the first layout in the first row). The WordArt text is converted to a single-item SmartArtobject. See the figure above. • SAVEthe presentation. • LEAVE the presentation open to use in the next exercise.
Modifying SmartArt • Although a new SmartArt graphic makes an interesting visual statement on a slide in its default state, you will probably want to make some changes to the graphic to customize it for your use. • You can apply a wide variety of formatting changes to modify appearance, and you can also change layout or orientation and add or remove shapes. • You can even change the diagram type to another that better fits your data.
Applying a Style to a SmartArt Diagram • Like other graphic objects, SmartArt diagrams can be quickly and easily formatted by applying a SmartArt Style. • Styles apply fills, borders, and effects to improve the appearance of the diagram’s shapes. • In this exercise, you will apply a style to a diagram.
Step-by-Step: Apply a Style to a SmartArt Diagram • USEthe Litware Finalpresentation that is still open from the previous exercise. • Go to slide 3 and click once on the diagram to select it. Take care to select the diagram itself, and not a particular shape within it. • Click the SmartArt ToolsDesign tab to activate it. • Click the More button in the SmartArt Styles group. The SmartArt Style gallery appears, as shown above.
Step-by-Step: Apply a Style to a SmartArt Diagram • Click the Cartoon style. PowerPoint applies the style, as shown at right. • Go to slide 1, click the SmartArt object, and repeat steps 2-4 to apply the same style. • Go to slide 4, click the SmartArtobject, and repeat steps 2-4 to apply the same style. • SAVEthe presentation and CLOSE it. • LEAVE the presentation open to use in the next exercise.
Step-by-Step: Apply a Style to a SmartArt Diagram • SmartArt Styles can instantly improve a new diagram by applying visual effects to the shapes. Review the results carefully, however, after applying a SmartArt Style. If your shapes contain several lines of text, some of the 3-D styles may obscure the text or cause it to run over on the edges—not a very attractive presentation. • If you do not like the formatting you have applied, you can easily revert to the original appearance of the diagram. Click the Reset Graphic button on the SmartArt Tools Design tab to restore the diagram to its default appearance.
Selecting a Color Theme for a SmartArt Diagram • By default, diagrams display using variants of a single theme color. • Use the Change Colors gallery to apply a different theme color to a diagram. • In this exercise, you will apply a different color theme to a SmartArt diagram.
Step-by-Step: Apply a Color Theme to a SmartArt Diagram • USEthe Litware Finalpresentation that is still open from the previous exercise. • Go to slide 3 and click the diagram to select it. Click the SmartArt Tools Design tab. • Click the Change Colors button in the SmartArt Styles group. The Change Colors gallery opens. • Click the fourth style in the Colorful section (Colorful Range – Accent Colors 4 to 5). PowerPoint applies theme colors differentiated by level. • Go to slide 4 and click the diagram to select it.
Step-by-Step: Apply a Color Theme to a SmartArt Diagram • Click the Change Colorsbutton in the SmartArt Stylesgroup, opening the Change Colors Gallery, and then click the first style in the Colorful section (Colorful Accent Colors). PowerPoint uses theme colors to apply different tints to each shape (See above). • SAVEthe presentation. • LEAVE the presentation open to use in the next exercise.
Step-by-Step: Apply a Color Theme to a SmartArt Diagram • The Change Colors gallery provides a quick way to apply variations of theme colors to an entire diagram. If the gallery choices don’t strike your fancy, you can manually apply theme colors (or any non-theme color) by using tools on the SmartArt Tools Format tab. Click an individual shape or use the Shift or Ctrl keys to select more than one shape, and then choose a shape style from the Shape Styles gallery. You can also use the Shape Fill, Shape Outline, and Shape Effects buttons to choose new colors, outlines, or effects for the selected shapes. • If you do not like the changes you have made to a particular shape, you can reset the shape formats. Right-click the shape, then click Reset Shape on the shortcut menu.
Changing a SmartArt Diagram’s Layout • If you decide a particular layout does not present your data as you like, you can easily choose a new layout. A different layout can dramatically change the way the data appears. • Different layouts may be more or less suited to your data, so you may want to try several different layouts to find the best match. • In this exercise, you will change a SmartArt diagram to a different layout.
Step-by-Step: Change the Layout of a SmartArt Diagram • USEthe Litware Finalpresentation that is still open from the previous exercise. • Click the diagram on slide 4 to select it, if necessary. Make sure you select the outer frame of the diagram—not an individual shape. • Click the More button in the Layoutsgroup to display the Layouts gallery. • Click Continuous Cycle(see right). PowerPoint applies the new cycle layout to the current chart, as shown in Figure on the next slide.
Step-by-Step: Change the Layout of a SmartArt Diagram • SAVEthe presentation. • LEAVE the presentation open to use in the next exercise. • When changing a layout, you should generally choose from among the layouts of the current diagram type. In many cases, changing a layout will not result in additional work for you; PowerPoint adjusts the current text into new shapes or configurations.
Step-by-Step: Change the Layout of a SmartArt Diagram • In some cases, however, your information will not convert seamlessly from one layout to another. • Some layouts allow only a limited number of shapes, and if your original layout had more than the number allowed in the new layout, information that cannot be displayed in the new layout may disappear.
Adding a New Shape to a Diagram • As you work with diagrams, you may need to add shapes to accommodate your information. • Use the Add Shape button to choose what kind of shape to add and where to insert it in the diagram. • Adding a new shape to a diagram causes all the existing shapes to resize or reposition in the diagram to make room for the new shape.
Step-by-Step: Add a Shape to a Diagram • USEthe Litware Finalpresentation that is still open from the previous exercise. • Go to slide 3 and click the diagram to select it. Make sure you select the diagram’s outer frame, and not a specific shape within it. • Click the SmartArt Tools Design tab. • Click the last shape in the last row (Pat Cramer) to select it. • Click the Add Shape drop-down arrow in the Create Graphic group. PowerPoint displays a menu of options for adding a shape relative to the current shape, see above.
Step-by-Step: Add a Shape to a Diagram • Click Add Shape Below. PowerPoint adds a subordinate shape to the Pat Cramer shape. • Type Hannah Wong in the new shape, press Enter, and type Product Coordinator. Then click away from the diagram to deselect it. The slide should look similar to the figure at right. • Select Hannah Wong’s shape. On the SmartArt Tools Design tab, click the Add Shape drop-down arrow, then click Add Shape Below. PowerPoint adds a subordinate shape.
Step-by-Step: Add a Shape to a Diagram • Type Allan Morgan into the new shape, press Enter, and type Software Design. • With Allan Morgan’s shape still selected, click the Add Shape drop-down arrow, then click Add Shape After. PowerPoint adds a shape on the same level. • Type Kyle Porter in the new shape, press Enter, and type Package Design. • Click away from the diagram to deselect it. Your slide should look similar to the figure at right. • SAVEthe presentation. • LEAVE the presentation open to use in the next exercise.
Step-by-Step: Add a Shape to a Diagram • The choices available on the Add Shape drop-down menu depend on the type of diagram you are working with. You can choose among some or all of these options: • Add Shape After inserts a new shape to the right of the selected shape on the same level. (If the diagram displays shapes vertically, the new shape may appear below the selected shape.) • Add Shape Before inserts a new shape to the left of the selected shape on the same level. (If the diagram displays shapes vertically, the new shape may appear above the selected shape.)
Step-by-Step: Add a Shape to a Diagram • Add Shape Above inserts a new shape on the level above the selected shape. The new shape is superior to the selected shape. • Add Shape Below inserts a new shape in the level below the selected shape. The new shape is subordinate to the selected shape. • Add Assistant inserts a new assistant shape subordinate to the selected shape. This option is available only in organization charts.
Removing a Shape from a Diagram • You can easily delete shapes you don’t need. When you remove a shape from a diagram, PowerPoint resizes the other shapes to take advantage of the increased space in the diagram container. • Font sizes usually increase accordingly, too. For this reason, you should not do any manual formatting of text and shape size until you have finalized the number of shapes in the diagram. • You will learn about manually formatting the text and shapes later in this lesson.
Step-by-Step: Remove a Shape from a Diagram • USEthe Litware Finalpresentation that is still open from the previous exercise. • Go to slide 4, and click the diagram to select it. • Click the Update shape to select it. Make sure you select the shape, and not the text within it. • Press Delete. PowerPoint removes the shape and reconfigures the diagram, as shown at right. • SAVEthe presentation. • LEAVE the presentation open to use in the next exercise.
Changing a Diagram’s Orientation • You can change the look of a diagram by modifying the way shapes are positioned in the diagram. • You can use the Right to Left and Layout buttons to adjust diagram orientation. • In this exercise you will reverse a diagram’s orientation and change the layout of a section of an organization chart.
Step-by-Step: Change a Diagram’s Orientation • USEthe Litware Finalpresentation that is still open from the previous exercise. • Go to slide 3 and click the diagram to select it. Make sure you select the entire diagram. • Click the SmartArt Tools Designtab, if it is not already displayed. • Click the Right to Left button in the Create Graphic group. PowerPoint flips the diagram horizontally so that shapes on the right side are now on the left side, as shown above.
Step-by-Step: Change a Diagram’s Orientation • Click in the top-level shape (Ted Hicks). Make sure you select the shape, and not the text within it. • Click the Layout button in the Create Graphic group. PowerPoint displays options for positioning the shapes relative to the top-level shape. • Click Left Hanging. The sub-ordinate shapes are arranged vertically below the top-level shape, rather than horizontally, as shown at right. • Click the Layout button, then click Standard to restore the original layout.
Step-by-Step: Change a Diagram’s Orientation • Click the Hannah Wongshape, click the Layoutbutton, and then click Both. The subordinate shapes display hori-zontally rather than vertically, as shown in the figure at right. • SAVEthe presentation. • LEAVE the presentation open to use in the next exercise.
Step-by-Step: Change a Diagram’s Orientation • You can use the Right to Left button with any diagram that distributes shapes and information horizontally across the slide. Right to Left has no impact on diagrams that center information, such as Pyramid diagrams. • The Layout button is available only in organization charts with a shape that is superior to subordinate shapes selected. • You do not have to use the default orientation and positioning of shapes if you would prefer another arrangement. You can click any shape to select it and drag it to a new location. If the shape is connected to other shapes, as in an organization chart, the connector lines shift position or change shape to maintain the connection.