Download
1 / 34
360 likes | 892 Views
1. SmartArt Graphics are arranged in eight categories: List Process Cycle Hierarchy Relationship Matrix Pyramid Picture. Preview and purpose. Figure 7-1. Use Graphical Lists to Show Groups of Information. Exercise 7-1. 1. A SmartArt graphic list can be created in two ways:

E N D
1 • SmartArt Graphics are arranged in eight categories: • List • Process • Cycle • Hierarchy • Relationship • Matrix • Pyramid • Picture Preview and purpose Figure 7-1
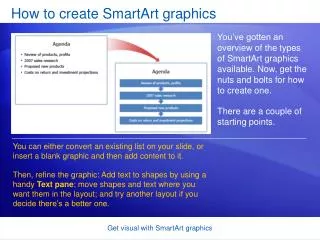
Use Graphical Lists to Show Groups of Information Exercise 7-1 1 • A SmartArt graphic list can be created in two ways: • Start with a Title and Content slide layout, click the SmartArt button, and key content using a Text pane. • Start with an existing bulleted list, and convert it to a SmartArt graphic. Text pane Figure 7-2
Use Graphical Lists to Show Groups of Information Exercise 7-1 1 Figures 7-3 and 7-4
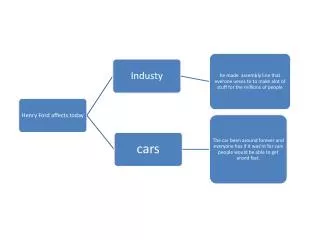
Exercise 7-2 1 • A process diagram reflects concepts or events that occur sequentially. Figure 7-5
Exercise 7-3 1 • The cycle diagram is used to communicate a continuing sequence. Figure 7-6
Exercise 7-4 2 • Select the shapes that contain text content in a SmartArt diagram. • From the Home tab, in the Drawing group, click the Quick Styles button. • Click one of these thumbnails to apply the effect. Figure 7-7
Exercise 7-5 2 • Select the shapes that contain text content in a SmartArt diagram. • From the Home tab, in the Drawing group, click the Shape Effects button then choose 3-D Rotation. • Click angles from the Parallel, Perspective, or Oblique categories. Figure 7-8
Exercise 7-6 2 • Diagrams can be resized like any other object. • Be sure the text is still readable if the size of shapes is reduced. • Use only a single word on small shapes. Figure 7-9
Exercise 7-7 2 • Select a shape then click the bottom of the Add Shape button. • Choose Add Shape After. The new shape appears below the first shape and the diagram is resized. • Options include before and after as well as above and below. Figure 7-10
Exercise 7-8 2 To change SmartArt colors: • From the SmartArt Tools Design tab, in the SmartArt Styles group, click the Change Colors button. • Colors are arranged in eight categories: Primary Theme Colors, Colorful, and six Accent colors. • Point to the thumbnails to preview and then click to apply. Figure 7-11
Exercise 7-8 2 To change SmartArt styles: • From the SmartArt Tools Design tab, in the SmartArt Styles group, point to thumbnails to preview. • Click to apply. To reset and remove changes: • From the SmartArt Tools Design tab, in the Reset group, click the Reset Graphic button and the original style of your diagram is restored. SmartArt Styles Figure 7-12
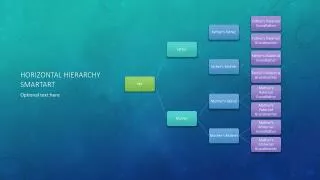
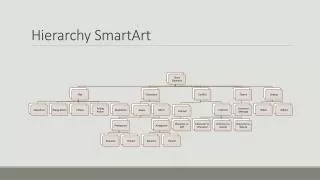
Exercise 7-9 3 • An organization chart is in the Hierarchy category. • It begins with five rectangular shapes. • Each shape is positioned on a level, indicating its position in the hierarchy. • The top shape indicates the highest level with a direct line down to the second level. • A shape that branches from the central line reflects a supporting position. Figure 7-13
Exercise 7-10 3 • Subordinate. Shapes that are connected to a superior shape (a shape on a higher level). • Coworker. Shapes that are connected to the same superior shape as another shape. • Assistant. Shapes that are usually placed below a superior shape and above subordinate shapes.
Exercise 7-10 3 • Select the shape that will be a superior; then from the SmartArt Tools Design tab, in the Create Graphic group, click the lower half of the Add Shape button. • From the list select Add Shape Below. Standard layout Figures 7-14 and 7-15
Exercise 7-11 3 • From the SmartArt Tools Design tab, in the Create Graphic group, • To add an assistant shape, select the level 1 shape. • Click the Add Shape button and choose Add Assistant. • To add a coworker shape, select a coworker shape. • Click the Add Shape button and choose Add Shape Before. Right hanging layout Figure 7-16
Change Layout, Delete Shapes, and Reorder Shapes Exercise 7-12 3 • Select a shape that has subordinate shapes. • From the SmartArt Tools Design tab, in the Create Graphic group, click the Layout button and choose Standard. • The subordinate shapes (co-workers) are shown side by side instead of in a vertical, hanging arrangement. Standard layout Figure 7-17
Change Layout, Delete Shapes, and Reorder Shapes Exercise 7-12 3 • Select a shape that has subordinate shapes. • From the SmartArt Tools Design tab, in the Create Graphic group, click the Layout button and choose Right Hanging. • The subordinate shapes (co-workers) are shown in avertical, hanging arrangement. Right hanging layout Figure 7-18
Exercise 7-12 3 To promote or demote: • Select a subordinate shape. From the SmartArt Tools Design tab, in the Create Graphic group, click the Promote or Demote button. • Any shapes connected to the selected shape will move with it. To move groups left or right: • From the SmartArt Tools Design tab, in the Create Graphic group, click the Right to Left button. • Repeat this process as needed for other shapes.
Exercise 7-13 3 • Resize the SmartArt area by dragging its borders to expand it horizontally and vertically. • Select one or more individual shapes: • Resize horizontally and vertically to fit text. • Change font sizes. • Change fill colors, styles, and effects. Each level has a different color Figure 7-19
Exercise 7-14 4 • A radial diagram starts with a central circle (level 1) with four circles (level 2) connected to and surrounding the center circle. • Add circles as needed to illustrate your message. Figure 7-21
Exercise 7-15 4 • The gear diagram communicates interlocking ideas. • Shapes fit together and each affects the others. Figure 7-22
Exercise 7-16 4 • The continuous picture list contains round placeholders for pictures. • The horizontal arrow communicates that the items shown represent interconnected information. Figure 7-23
Exercise 7-17 5 • Be sure to notice how the level 1 and level 2 information is arranged and consider the emphasis that each level receives. • For example, consider these three diagrams: • Table Hierarchy • Grouped List • Vertical Arrow List Figure 7-24
Exercise 7-18 5 • Select the SmartArt diagram. • From the SmartArt Tools Design tab, in the Layouts group, click the More button and choose the layout that you prefer. • Adjust shapes as needed to fit within the layout. Figure 7-25
Exercise 7-19 5 • Select the SmartArt diagram. • From the SmartArt Tools Design tab, in the Reset group, click the Convert button. • Choose Convert to Text and the diagram changes to a bulleted list. • Choose Convert to Shapes and the diagram changes to separate shapes. Figure 7-26
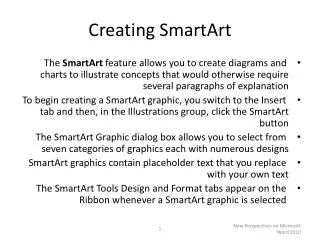
Lesson 7 Presentation SmartArt graphics create a visual representation of your information that can help people better understand and remember your message. Be sure your layout is clear and easy to follow. Keep text very concise so it fits on the shapes.