Download
1 / 30
300 likes | 304 Views
EVSC 1300 Earth ’ s Weather and Climate. Scales of Motion. Scales of Motion. Increasing size. Increasing duration. Scales of Motion. Mercury Barometer. Aneroid Barometer. Barograph or Recording Barometer. Barograph Trace Charlottesville Jan. 5–10, 2009. Time of frontal passage

E N D
EVSC 1300 Earth’s Weather and Climate
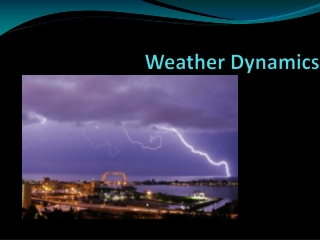
Scales of Motion Increasing size Increasing duration
Barograph Trace Charlottesville Jan. 5–10, 2009 Time of frontal passage (4–6 p.m., Jan. 7)
Sea-level pressure variations
Station vs. Sea-level Pressure station pressure—barometer measurement correction factor for elevation resulting map of sea-level pressure variations (surface map)
Sea-level Pressure Map Influence of topography (elevation) on pressure has been removed
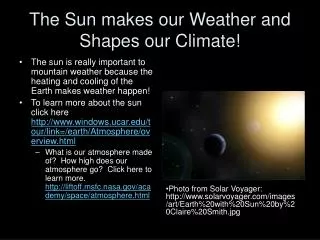
Earth’s atmosphere is thin relative to the size of the planet.
Change of Air Pressure with Height 10% of atmosphere’s mass above 100 mb 100 mb 90% of atmosphere’s mass below 100 mb
500 mb Map Upper air map showing winds and other variables at the “mid-point” of the atmosphere.
air molecules Number of air molecules determine surface pressure (Note: Unrealistic example...constant density and fixed top)
L E S S D E N S E SAME TEMPERATURE D E N S E TWO BAROMETERS Air Column Air Column Low Pressure High Pressure Barometer Barometer At same temperature, dense air has higher pressure than less dense air
Reference Level Impact of Heating and Cooling on Pressure Warming or cooling air can induce pressure changes. Pressure change can produce air motion—wind!
Pressure and Density Same temperature at both locations Denser air produces higher surface pressure (Chap. 8; pp. 199–206)
Wind Direction (16-point compass) Wind is defined based on the direction from which it is coming.
Cyclones and Anticyclones Surface Low = CYCLONE (counter-clockwise winds) Surface High = ANTICYCLONE (clockwise winds) (N. Hemisphere)
Cold vs. Warm Air Parcels Cold air is denser that warm air (at the same pressure)
Surface Air Temperature Variations
Composition of Atmosphere Variable Permanent
SOURCE (to atmosphere) SINK (removal from atmosphere) • Fixed by (incorporated into) soil bacteria • Fixed by ocean phytoplankton • Lightning N2 • Denitrification by anaerobic • bacteria in wet soil • Aerobic bacterial processes • Combustion • Respiration (oxidation: food to energy) • Ocean phytoplankton • Photosynthesis O2 Vis. light 6 CO2 + 6 H2O C6H12O6 + 6 O2 • Photosynthesis • Fixation by ocean phytoplankton • Dissolved directly into ocean surface • Respiration • Combustion CO2 STORAGE: limestone sediments, marine shells, fossil fuels
SOURCE (to atmosphere) SINK (removal from atmosphere) • Anaerobic processes • (wetlands, rice paddies) • Bovine flatulence • Termites • Biomass burning • Interaction with hydroxyl in atmosphere • Soils CH4 CH4 + OH CH3 + H2O • Bacteria in soils/oceans • (nitrification) • Combustion (cars, biomass) • Fertilizers • Stratospheric photochemistry • (converted to NOx) N2O O2 + O O3 O3 + uv O2 + O O3 Also chlorine, bromine, NOx • Evaporation from open water • Sublimation (from ice) • Transpiration (through plants) • Condensation onto surfaces • Precipitation • Deposition H2O
Average vertical temperature structure of atmosphere (Chap. 1)
Variation of Tropopause Height by Latitude Tropopause is higher over equator and lower over poles