Download
1 / 19
190 likes | 342 Views
A New View of Accretion Shock Structure Nancy S. Brickhouse Harvard-Smithsonian Center for Astrophysics Collaborators: Steve Cranmer, Andrea Dupree, Juan Luna, and Scott Wolk. Accretion Processes in X-rays: From White Dwarfs to Quasars Boston, MA 14 July 2010.

E N D
A New View of Accretion Shock StructureNancy S. BrickhouseHarvard-Smithsonian Center for AstrophysicsCollaborators: Steve Cranmer, Andrea Dupree, Juan Luna, and Scott Wolk Accretion Processes in X-rays: From White Dwarfs to Quasars Boston, MA 14 July 2010
Diverse X-ray Spectra from Young Stars Observed with Chandra HETG
Accretion shock models → Te and Ne for given mass accretion rate • Kastner et al. (2002) find high Ne in TW Hya • ChandraLarge Observing Program to definitively establish accretion as the source of the emission, and, if confirmed, bring new diagnostics to bear, using 500 ksec High Energy Transmission Grating
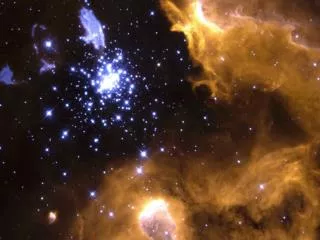
TW Hya • Classical T Tauri star (accreting) • i=7o (pole-on) • M = 0.8 MSun • R = 0.7 RSun • Distance 57 pc • 10 million yr old • Poised to make planets • X-rays from the accretion shock (Kastner et al. 2002) • X-ray plasma has high Neon abundance (Kastner et al. 2002; Drake, Testa, & Hartmann 2005) Romanova et al. 2004
Accretionand aCorona Emission Measure vs Te Light curve Emission measure distribution and variability allow us to isolate the accretion shock. Brickhouse et al. 2010, ApJ, 710, 1835
He-like Line Ratio Diagnostics He-like Energy Levels Ne and Te Diagnostic Ratios (Smith et al. 2009)
Accurate Atomic Theory:Ne IX G-ratio DiagnosticG-ratio vs Te Chen et al. 2006 Smith et al. 2009
He-like Ions in TW Hya: O VII, Ne IX, and Mg XI Diagnostics for Te and Ne
X-Ray Line Ratio Diagnostics for Density and Temperature Ne = 6 x 1012 cm-3 Mg XI 3 x 10¹² Ne IX 6 x 10¹¹ O VII Te = 2.50 ± 0.25 MK This looks like the accretion shock!
Neon Region of HETG Spectrum Spectrum shows strong H-like Ne X and He-like Ne IX, up to n=7 or 8 in Ne X. Series lines are sensitive to absorption
Complex absorption • O VII: NH = 4.1 x 1020 cm-2 • Ne IX: NH = 1.8 x 1021 cm-2 Series lines rule out resonance scattering: Tau ~ g f λ, for a given ion
Testing the Accretion Shock Model 2GM* R* Vff = (1 – R*/rt )1/2 ~ 510 km/s Te = 3.4 MK Macc = f A*ρpre vff ● (Konigl 1991; Calvet & Gullbring 1998; Gunther et al. 2007; Cranmer 2008)
Testing the Accretion Shock Model 2GM* R* Vff = (1 – R*/rt )1/2 ~ 510 km/s Te = 3.4 MK Macc = f A*ρpre vff ● (Konigl 1991; Calvet & Gullbring 1998; Gunther et al. 2007; Cranmer 2008) “Settling”
Te and Ne from Ne IX agree with the shock model.Model predicts Ne at O VII 7 times larger than observed. • Consider a new 2-Region model: • Region 1 = the shock front • Region 2 = the post-shock region • Each region: Ne , Te, NH, V, and M • Predict r, i, and f for He-like ions • V2 = 300 x V1 => M2 = 30 x M1
Te and Ne from Ne IX agree with the shock model.Model predicts Ne at O VII 7 times larger than observed. • Consider a new 2-Region model: • Region 1 = the shock front • Region 2 = the post-shock region • Each region: Ne , Te, NH, V, and M • Predict r, i, and f for He-like ions • V2 = 300 x V1 => M2 = 30 x M1 Definitely not “settling”
Soft X-ray Excess (OVII) Ubiquitous Gudel & Telleschi 2007 also see Robrade & Schmitt 2007
Accretion Variability • Ne IX diagnostics for 3 observation segments ~150 ksec each give different Te and NH (Ne does not vary). • Variable Te implies changing rin, and thus Mdot • Observed diagnostics constrain model Mdot , B, and rout • Te varies from 3.1 to 1.9 K • Mdot varies a factor of ~5 • Filling factor varies a factor of ~7 • rin varies from 1.75 R* to 3.52 R* • B varies from 800 to 500 G Brickhouse et al. 2010, in progress
Conclusions • High S/N HETG spectrum derives from 3 regions: a hot 10 MK corona, an accretion shock, and a cool post-shock region. • Diagnostics show excellent agreement with simple models of the shock itself. • Diagnostics show that standard, one-dimensional models of the post-shock cooling plasma don’t work. • Te and NH vary (Ne does not), implying variability in Mdot, B, and rtrunc • Our values for Mdot are in good agreement with optical and UV methods.