Download
1 / 10
110 likes | 145 Views
This presentation educates you about R - Poisson Regression with example, Create Regression Model with basic syntax example.<br><br>For more topics stay tuned with Learnbay.

E N D
R - Poisson Regression Swipe
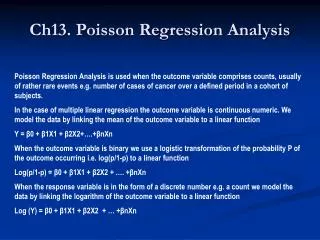
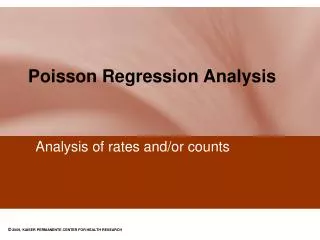
R - Poisson Regression Poisson Regression involves regression models in which the response variable is in the form of counts and not fractional numbers. For example, the count of number of births or number of wins in a football match series. Also the values of the response variables follow a Poisson distribution. The general mathematical equation for Poisson regression is:- log(y) = a + b1x1 + b2x2 + bnxn
Following is the description of the parameters used − y is the response variable. a and b are the numeric coefficients. x is the predictor variable. The function used to create the Poisson regression model is the glm() function. The basic syntax for glm() function in Poisson regression is:- glm(formula,data,family)
Following is the description of the parameters used in above functions − formula is the symbol presenting the relationship between the variables. data is the data set giving the values of these variables. family is R object to specify the details of the model. It's value is 'Poisson' for Logistic Regression.
Example We have the in-built data set "warpbreaks" which describes the effect of wool type (A or B) and tension (low, medium or high) on the number of warp breaks per loom. Let's consider "breaks" as the response variable which is a count of number of breaks. The wool "type" and "tension" are taken as predictor variables. Input Data input <- warpbreaks print(head(input))
When we execute the above code, it produces the following result:- breaks wool tension 1 26 A L 2 30 A L 3 54 A L 4 25 A L 5 70 A L 6 52 A L
Create Regression Model output <-glm(formula = breaks ~ wool+tension, data = warpbreaks, family = poisson) print(summary(output)) When we execute the above code, it produces the following result:- Call: glm(formula = breaks ~ wool + tension, family = poisson, data = warpbreaks) Deviance Residuals: Min 1Q Median 3Q Max -3.6871 -1.6503 -0.4269 1.1902 4.2616
Coefficients: Estimate Std. Error z value Pr(>|z|) (Intercept) 3.69196 0.04541 81.302 < 2e-16 *** woolB -0.20599 0.05157 -3.994 6.49e-05 *** tensionM -0.32132 0.06027 -5.332 9.73e-08 *** tensionH -0.51849 0.06396 -8.107 5.21e-16 *** --- Signif. codes: 0 ‘***’ 0.001 ‘**’ 0.01 ‘*’ 0.05 ‘.’ 0.1 ‘ ’ 1 (Dispersion parameter for poisson family taken to be 1) Null deviance: 297.37 on 53 degrees of freedom Residual deviance: 210.39 on 50 degrees of freedom AIC: 493.06 Number of Fisher Scoring iterations: 4
In the summary we look for the p-value in the last column to be less than 0.05 to consider an impact of the predictor variable on the response variable. As seen the wooltype B having tension type M and H have impact on the count of breaks.
Topics for next Post R - Time Series Analysis R - Nonlinear Least Square R - Decision Tree Stay Tuned with