Download
1 / 10
120 likes | 225 Views
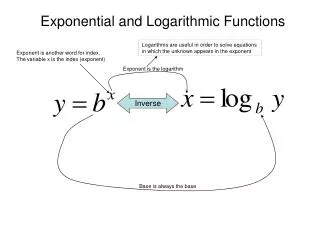
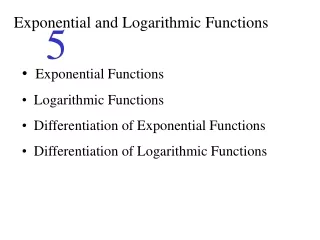
Exponential Function. Logarithmic Function. Data Analysis - Exponential and Logarithmic Regression.

E N D
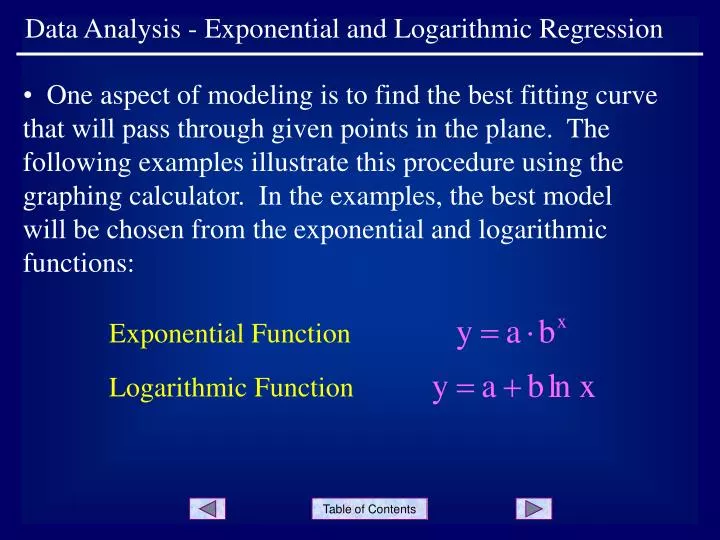
Exponential Function Logarithmic Function Data Analysis - Exponential and Logarithmic Regression • One aspect of modeling is to find the best fitting curve that will pass through given points in the plane. The following examples illustrate this procedure using the graphing calculator. In the examples, the best model will be chosen from the exponential and logarithmic functions:
Data Analysis - Exponential and Logarithmic Regression • Note: it is assumed that you are already somewhat familiar with the STAT and STAT PLOT menus. If you have not already done so, it would be a good idea to view the Linear Regression slideshow listed earlier in the table of contents. Slide 2
Data Analysis - Exponential and Logarithmic Regression • Example 1: The data for a person’s salary is given in the table. Find the best model to represent the data and then use the model to predict the expected salary for 1994. • Assume that the function model is of the form y = f(x) where x = 0 represents 1990, and y represents the salary. • The first step is to enter the data into the calculator. Slide 3
Data Analysis - Exponential and Logarithmic Regression • Press STAT|EDIT and enter the data into L1 and L2 ... • Press STAT PLOT and turn PLOT1 ON ... • Clear any functions in the Y= menu ... Slide 4
Data Analysis - Exponential and Logarithmic Regression • Press ZOOM|ZoomStat ... and the data points appear on the graph. • Press WINDOW ... and make the following changes. • Press GRAPH to once again see the points. • Note that the points fit an exponential form better than a linear or logarithmic form. Slide 5
Data Analysis - Exponential and Logarithmic Regression • To find the Exponential Regression Equation, press STAT|CALC|ExpReg. • With ExpReg showing on the home screen, press ENTER. • Rather than typing this function into Y1, press Y= ... press VARS|Statistics ... and then EQ|RegEQ. • This process will paste the last regression equation calculated into Y1. Slide 6
Data Analysis - Exponential and Logarithmic Regression • Press GRAPH to see both the model and the set of data points on the same coordinate plane. • It appears to be a good fit, so we accept the exponential function ... • To answer the second question (find the expected salary for 1994), use the TABLE and x = 4. • The expected salary is • $33,875. Slide 7
Data Analysis - Exponential and Logarithmic Regression • Example 2: Assume that the monthly ouput of a worker at a factory is given in the table. Find the best model to represent the data. • Clear the function in Y1 and then enter the data into L1 and L2 as in example 1. Plot the data using a suitable window. Slide 8
Data Analysis - Exponential and Logarithmic Regression • The graph should be similar to ... • Note that the points fit a logarithmic curve. Press STAT|CALC|LnReg ... and then paste the function into Y1 using VARS. • Press GRAPH ... and it appears to be a fairly good fit. The function with rounded values is ... Slide 9
Data Analysis - Exponential and Logarithmic Regression END OF PRESENTATION Click to rerun the slideshow.