Download
1 / 5
50 likes | 136 Views
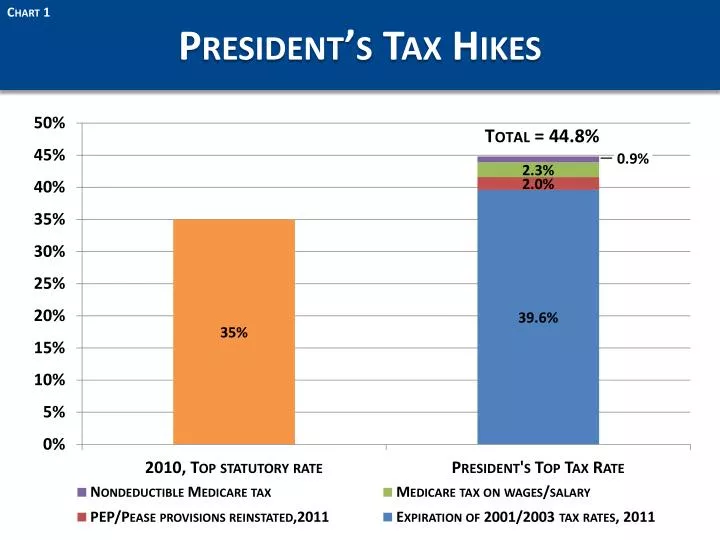
Chart 1. President’s Tax Hikes. Chart 2. Tax Relief Made Tax Code More Progressive Breakdown of Tax Burden by Income Level – 2001 vs 2008. Chart 3. Tax Revenues Do Not Correlate Well with Tax Rates. 100%. 90%. 80%. Top Income Tax Bracket . 70%. 60%. 50%. 40%. 30%.

E N D
Chart 1 President’s Tax Hikes
Chart 2 Tax Relief Made Tax Code More ProgressiveBreakdown of Tax Burden by Income Level – 2001 vs 2008
Chart 3 Tax Revenues Do Not Correlate Well with Tax Rates 100% 90% 80% Top Income Tax Bracket 70% 60% 50% 40% 30% Total Tax Revenue as Percent of GDP 20% Income Tax Revenue as Percent of GDP 10% 1950 1955 1960 1965 1970 1975 1980 1985 1990 1995 2000 2005 Fiscal Year
Chart 4 Tax Revenues are Highly Correlated With GDP Real 2006 GDP ($Billions) Real 2006 Tax Revenues ($Billions) $14,000 Real Tax Revenue $2,500 $2,000 $10,500 Real GDP $1,500 $7,000 $1,000 $3,500 $500 1950 1960 1970 1980 1990 2000
Chart 5 Chasing Higher Spending with Taxes(Increase in Tax Rates Necessary to Keep Pace Spending)