Download
1 / 27
270 likes | 349 Views
Electron-Cloud Build-up in the FNAL Main Injector and the LHC Complex. Miguel Furman LBNL ECLOUD07 Daegu, April 9-12, 2007. Outline. Motivation POSINST code features Initial results Ongoing work Conclusions. My gratitude to:

E N D
Electron-Cloud Build-up in the FNAL Main Injector and the LHC Complex Miguel Furman LBNL ECLOUD07 Daegu, April 9-12, 2007
Outline • Motivation • POSINST code features • Initial results • Ongoing work • Conclusions My gratitude to: A. Adelmann, G. Arduini, V. Baglin, M. Blaskiewicz, O. Brüning, Y. H. Cai, C. Celata, R. Cimino, R. Cohen, I. Collins, F. J. Decker, A. Friedman, O. Gröbner, K. Harkay, P. He, S. Heifets, N. Hilleret, U. Iriso, J. M. Jiménez, R. Kirby, M. Kireef-Covo, G. Lambertson, R. Macek, A. Molvik, K. Ohmi, S. Peggs, M. Pivi, C. Prior, A. Rossi, G. Rumolo, D. Schulte, K. Sonnad, P. Stoltz, J.-L. Vay, M. Venturini, S. Y. Zhang, X. Zhang, A. Zholents, F. Zimmermann and R. Zwaska.
ecloud at FNAL: background • Proposed High Intensity Neutrino Source (HINS) • MI upgrade: • Increase bunch intensity Nb from ~6e10 to ~3e11 • RFA electron detectors installed (one in the MI and one in the Tevatron) • See R. Zwaska’s talk (session B) • We’ve been simulating ecloud effects at the MI for >~1 yr • Goal: assess ecloud effects on the operation • ecloud build-up (this talk) • ecloud effects on the beam • simulations of microwave transmission through ecloud (Caspers-Kroyer diagnostic technique) • see Kiran Sonnad’s talks (sessions D & E)
“POSINST” simulation code features Code development started ~1994 (PEP-II design stage) essential contributions by M. Pivi since 2000 this is a “build-up type” code Formation of an ecloud by a prescribed (non-dynamical) beam Based on Ohmi’s original simulation approach Similar to other codes (e.g., “ECLOUD”, …) 2D incorporates a detailed model of SEE both SE yield d(E0) and SE emission energy spectrum dd/dE incorporates approximate models of primary electron emission validated against measurements at APS and PSR (~2000) good agreement with RFA measurements required peak SEY ~2 both for PSR and APS SEY is an essential ingredient in most cases; however: many SEY parameters not well known can trade off one for another
Initial results • Preliminary assessment for MI upgrade: • Uniform fill (504 bunches out of 588 buckets) • Injection energy (K.E.=8 GeV) • Bunch population Nb=(6–30)x1010 • Elliptical chamber cross-section (~2:1) • Field-free or dipole bending magnet • Conclusions: • Sharp threshold at Nb~1.25x10¹¹ for dmax=1.3 • above threshold: EC ~neutralizes beam • Dn ~ 0.06 (assuming uniform EC density around the ring) • The assumed value dmax=1.3 was a first step Nb below thr. Nb above thr. M. Furman, LBNL-57634/FERMILAB-PUB-05-258-AD
Initial results: sz dependence • Lower de for shorter bunches • Possibly due to higher electron-wall impact energy e– flux at wall aver. de 1-s de e– energy SEY
Recent simulations at RFA location line density vs. time dmax=1.3 KEb=20 GeV • MI ramp: KEb=8120 GeV in ~0.9 s (~100,000 turns) • Transition at t~0.2 s (KEb~20 GeV) • train=(82 H) + 5x(82 L) + gaps, Nb=10.3x10¹⁰ for H Nb=5.7x10¹⁰ for L • RFA detector location: field-free region • We typically simulate only one turn • CPU~3.3 hrs (Mac G5, 1.8 GHz)
Recent simulations: 1-turn averages • From Bob Zwaska’s e– detector observations, infer e– flux ~1 mA/m2 at transition • this assumes 30% area efficiency and 100% e– energy efficiency • Then these simulations imply dmax >~ 1.3–1.4 • But direct measurements of chamber samples by R. Kirby show dmax~ 2 (R. Zwaska, session B) • Caveats: • Several variables not yet adequately investigated • Ongoing work; need to reconcile simulations and measurements e– wall flux vs. dmax e– density vs. dmax
Discussion • Other simulation exercises carried out: • Time development of ecloud • Dependence on sz, Nb and dmax but not in all combinations • Sensitivity to SE energy spectrum • Dependence on transverse beam size • Simulation parameters (e.g., Dt=1.4x10⁻¹¹ s, # of macroparticles=20,000,…) • Incidentally, find empirical relation between e– flux at the wall Je and e– aver. line density le: • Je=kle, where k=6x10⁷ m–1 s–1 • Fairly robust (independent of dmax, sz and Eb; even valid during the build-up stage, but not tested against all possible parameter variations)
Conclusions • Extensive (but still ongoing) build-up simulations of the MI • If interpret RFA measurements with these simulations, conclude that dmax~1.3–1.4; then de~(1–10)x1010 m–3 • Even if RFA detector is seeing only 10% of the incident electrons, would conclude that dmax~1.4–1.5 • But direct chamber sample measurements show dmax~2 • This is a significant discrepancy! • Need to reconcile simulations and measurements • Simulations results qualitatively stable against several simulation conditions • eg., Emax, SE spectrum composition, no. of macroparticles, Dt,… • Not yet done, or partially done: • Sensitivity to d(0) (thus far, assumed d(0)=0.3xdmax) • NB: if d(0) is assumed higher, then would conclude that dmax is lower • Further sensitivity to SE spectrum composition (elastics, rediffused, true secondaries) • Clarify simulation issues at high dmax: • appearance of “virtual cathodes” near the wall • dependence of SEY on space-charge forces (no such dependence in POSINST) • Ultimate goal: assess effects on the beam (see K. Sonnad’s talk session E)
References M. A. Furman, "A preliminary assessment of the electron cloud effect for the FNAL main injector upgrade," LBNL-57634/CBP-Note-712/FERMILAB-PUB-05-258-AD, June 28, 2005. Revised: June 26, 2006. An abbreviated version is published in: New Journal of Physics Focus Issue: Accelerator and Beam Physics, New J. Phys. 8 (2006) 279, http://stacks.iop.org/1367-2630/8/279 M. A. Furman, "Studies of e-cloud build up for the FNAL main injector and for the LHC," LBNL-60512/CBP Note-736, June 15, 2006, Proc. 39th ICFA Advanced Beam Dynamics Workshop on High Intensity High Brightness Hadron Beams "HB2006" (Tsukuba, Japan, May 29-June 2nd, 2006), paper TUAX05. http://hb2006.kek.jp/ M. A. Furman, "HINS R&D Collaboration on Electron Cloud Effects: Midyear Progress Report," CBP-Technote-364/FERMILAB-TM-2369-AD, 22 September 2006. M. A. Furman, K. Sonnad and J.-L. Vay, "HINS R&D Collaboration on Electron Cloud Effects: Midyear Report," LBNL-61921/CBP-761/FERMILAB-TM-2370-AD, Nov. 7, 2006. M. A. Furman, "HINS R&D Collaboration on Electron Cloud Effects: MI ecloud build-up simulations at the electron detector location," CBP Technote-367, Dec. 5, 2006. Kiran G. Sonnad, Miguel A. Furman and Jean-Luc Vay, "A preliminary report on electron cloud effects on beam dynamics for the FNAL main injector upgrade," CBP Technote-369, January 16, 2007.
Electron-wall energy spectrum dmax=1.7, KE=20 GeV, sz=0.06 m
Three components of secondary emission:sample spectrum at E0=300 eV E0 E from M. F. and M. Pivi, PRST-AB 5, 124404 (2002)
Secondary emission spectrum • Depends on material and state of conditioning • St. St. sample, E0=300 eV, normal incidence, (Kirby-King, NIMPR A469, 1 (2001)) • st. steel sample • d= 2.04 • de = 6% • dr = 37% • dts =57% • de+dr =43% • Cu sample • d= 2.05 • de = 1% • dr = 9% • dts =90% • de+dr =10% • Hilleret’s group CERN: Baglin et al, CERN-LHC-PR 472. • Other measurements: Cimino and Collins, 2003)
Sample simulated LHC heat load vs. Nbarc dipole, nominal beam energy Code POSINST (M. Furman, LUMI06 wkshp. et. seq.) NB: ACC calculation has been recently revised. See LUMI06 proc. dashed: LBNL simulations (codePOSINST) dmax=1.7 solid: CERN simulations (code ECLOUD) dmax=1.5 dmax=1.3 dotted: available cooling capacity for ecloud (ACC) • We don’t know what peak SEY dmax will be at start-up • but need to stay within cryogenic cooling capacity • Simulation gives an idea of where the LHC will be able to operate during run-in • Also: excellent agreement between LBNL and CERN simulations
Sample assessment of two PS upgrade options:heat load vs. peak SEY dmax • PS2: Eb=50 GeV • PS+: Eb=75 GeV • Bunch spacings: tb=25, 50, 75 ns • Conclusion: • PS2 and PS+ comparable • 75 ns slightly better than 50 ns • 50 ns much better than 25 ns Nb depends on tb: (Similar assessments carried out for SPS and LHC upgrades)
Sample simulated heat load vs. dmaxLHC and upgraded injectors: Cu vs. St.St. 120-150 W/m for St.St. SPS nom., tb=25 ns “SPS+”, tb=25 ns “PS2”, tb=25 ns LHC nom., tb=25 ns “PS2”, tb=50 ns • Effect of different emission spectra: • Smaller rediffused component in SE energy spectrum • Subtle mechanism; explained in detail in Sec. IV-B of http://prst-ab.aps.org/pdf/PRSTAB/v9/i3/e034403 • Caveat: Cu and StSt emission parameters need to be re-measured to confirm Cu advantage!
Conditioning • Peak SEY dmax vs e– dose: • dmax~1 when D~1 C/cm2 • under vacuum and steady e– current • ECE is a self-conditioning effect • Beam conditioning observed at SPS, PSR, PEP-II, RHIC… dmax vs. dose for TiN/Al Kirby & King, NIMPR A469, 1 (2001) ~1 C/cm2 dmax vs. dose for Cu Hilleret, 2stream2001 (KEK) 1 C/cm2
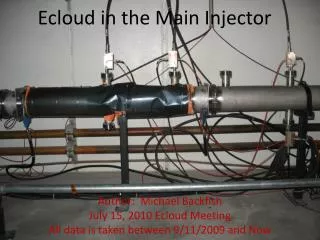
EC detectors installed recently RFA e– detectors (ANL design; Rosenberg-Harkay) measure flux and energy spectrum ion pump Main Injector Tevatron RFA beam separator ion gauge
What is the ECE • Step 1: beam produces primary electrons • Photoelectrons, ionization of residual gas, stray beam particles striking the chamber, … • Step 2: electrons get rattled around the chamber • Amplification by secondary electron emission • Particularly intense for positively-charged beams • Possible consequences: • dipole multibunch instability • emittance blowup • gas desorption from chamber walls • excessive energy deposition on the chamber walls (important for superconducting machines, eg. LHC) • particle losses, interference with diagnostics,… • The ECE is a consequence of the interplay between the beam and the vacuum chamber • beam intensity, bunch shape, fill pattern, photoelectric yield, photon reflectivity, secondary emission yield (SEY), vac. chamber size and geometry, …
Importance • PEP-II and KEKB: • controlling the EC was essential to achieve luminosity performance • ECE limits performance of PSR at high current • RHIC: vacuum pressure instability a high current • Possibly serious in future machines: • LHC: potentially large energy deposition from electrons • need to dissipate it • otherwise, less-than-nominal performance • ILC DR’s: potential for instability and/or emittance growth • main concern: wiggler regions • MI upgrade: • Nbx5; recently begun to investigate
Observations • ECE has been observed at many machines: • PF, PEP-II, KEKB, BEPC, PS, SPS, APS, PSR, RHIC, Tevatron(?), MI(?), SNS(?) • undesirable effects on performance, and/or • dedicated experiments • “Old” effects: • two-stream instabilities (BINP, mid 60’s) • beam-induced multipacting (ISR, mid 70’s) • multibunch effect • pressure rise instability • trailing-edge multipacting (PSR, since mid 80’s) • single-long-bunch effect • beam loss and instability
Controlling the ECE • Add weak solenoidal fields (~20 G) • confines electrons near the chamber, away from the beam • used in PEP-II and KEKB • RHIC tests • Tailor the bunch fill pattern (gaps in train) • used at PEP-II for a while, before solenoids • Modify vacuum chamber geometry • antechamber (eg., PEP-II) • antigrazing ridges (tests at RHIC) • grooves (LHC arcs; tests at SLAC) • Lower the SEY • coatings (TiN, TiZrV,…) • PEP-II, LHC, SNS, RHIC, … • conditioning
EC at FNAL: background • Proposed proton driver to replace booster • Proposed MI upgrade: • Increase bunch intensity from present 6e10 to 3e11 • New RF system • fRF not yet chosen (range considered=40-325 MHz), vs. 53 MHz at present • Bunch intensity and bunch frequency are essential ingredients for EC • Parameter regime has high potential for a significant EC
EC at FNAL: indirect evidence • At present: indirect evidence for an EC exists • But no direct electron measurements yet • Tevatron: • Fast pressure rise (X. Zhang, Dec. 02; May 05) • DP seen at some of the warm straight sections (ion pump measurements) • Threshold ~4e10 p/bunch for 30 consecutive bunches • No good way to measure P in cold regions • Fast emittance growth (flying wire technique) • de/dt~28p mm-mr/hr (95%, normalized, vertical, averaged over 30 bunches) • this is for E=150 GeV and N=82e10 in 30 bunches • this is much faster growth than estimated IBS growth rate • de/dt sensitive to N above threshold • Unfortunately, no BBB measurements
EC at FNAL: indirect evidence • Main Injector: • Fast pressure rise (R. Zwaska, Jan. 06) • 82 bunches of ~9e10 p/bunch, or 418 bunches of ~5e10 p/bunch • DP seen at 24 of 523 pumps • DP/P typically 5-50% • but reached 600%-700% at 2 pumps: uncoated ceramic chamber • NB: ceramic has a high SEY, therefore high DP/P is consistent with e-cloud hypothesis • Maximum effect at transition (short sz)