Download
1 / 47
470 likes | 474 Views
Using R and Longitudinal Data to Answer Policy Questions. Jared Knowles Wisconsin Department of Public Instruction NCES DC-STATS 2012 Washington DC, July 12, 2012. Overview. Why R? Examples of R Analyses? Share R code across states Develop joint methods Produce reports. Why R?.

E N D
Using R and Longitudinal Data to Answer Policy Questions Jared Knowles Wisconsin Department of Public Instruction NCES DC-STATS 2012 Washington DC, July 12, 2012
Overview • Why R? • Examples of R Analyses? • Share R code across states • Develop joint methods • Produce reports
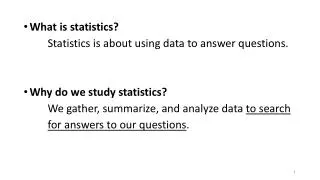
Why R? • R is free • R is open source • R is best in class and state of the art • R is free
R works for government • R is transparent • R is reproducible • R is accurate • R works! Today!
Google Scholar Hits R has recently passed Stata on Google Scholar hits and it is catching up to the two major players SPSS and SAS
Google Scholar Hits These links come from the explosion of add-on packages to R
R has an Active Web presence Usage of the R listserv for help has really exploded recently
R Examples Read in data
Simple Diagnostics plot of chunk unamed-chunk-1
Advanced Diagnostics plot of chunk unamed-chunk-2
More advanced Grade 3 Score Cohort Trends
Can this generate information? • Graphics help explain, but are still descriptive • R can help on two fronts: • R can do advanced analytics that provide insight • R can graphically depict those analytics in simple ways that are intuitive to policy makers • Oh yeah…? Prove it. • BLBC study in Wisconsin • Regression Trees • Machine Learning Algorithms
BLBC in Wisconsin • We fit statistical models to all the ESL students in Wisconsin modeling their future test score as best as possible through each strategy described above (on all three major assessments) • We also include an indicator of whether the student was eligible for BLBC instruction or not • We compare to see if the average student receiving BLBC did better than the average student receiving other ESL services, all else equal • We report the range of uncertainty around this difference between student groups and compare them to see if any meaningful differences emerge • Due to our large sample size we expect our results to be biased in favor of finding statistically significant results, so we also examine the magnitude of findings to see if they are substantively significant; i.e. is the difference big enough to matter in the lives of students?
Evaluations of Policy • Results are presented in effect sizes, or standard deviation units of change in test scores. • 0.1 is small, 0.2 to 0.4 is reasonable and is about a year of education in most cases. Bigger than 0.4 is huge.
Results I • The bars represent the 95% confidence internal around the estimate. The VAM model is consistently statistical significant, not overlapping 0, and negative. • The length of the bars • represent the uncertainty • about the estimate. But • the mean effect size • is quite small, less than • 0.1 standard deviations in • most cases. • This represents a • Year-to-year change in • student’s score Between • BLBC and non-BLBC • instruction.
Results II Language is different. Wisconsin has a large sample of both Hmong and Spanish speakers and they have different results when analyzed separately
Conclusions and Next Steps • In Wisconsin BLBC does not have the negative effects found in recent research on California, though a slight negative effect may exist in some cases • Unlike other states where BLBC has been studied, Wisconsin has substantially different results between language groups on mathematics and possibly on English proficiency achievement • There is still a lot of imprecision in the estimates used here and more precision would be helpful, but effects are not substantively large in terms of relative student performance, even in the upper and lower bounds
Next Steps • Get more data over more years and use a more precise estimation technique to reduce uncertainty about effects • Explore the variation across BLBC programs in addition to the mean effect • Learn more about the non-cognitive non-academic outcomes for BLBC in order to understand the costs and benefits of BLBC programs more fully • Estimate a “treatment-on-the-treated” parameter to more directly compare to prior research • Survey teachers and merge teacher/program practice data with student outcomes to begin exploring the effective components of BLBC and ESL programs
Inference Trees • Get more data over more years and use a more precise estimation technique to reduce uncertainty about effects • Explore the variation across BLBC programs in addition to the mean effect • Learn more about the non-cognitive non-academic outcomes for BLBC in order to understand the costs and benefits of BLBC programs more fully • Estimate a “treatment-on-the-treated” parameter to more directly compare to prior research • Survey teachers and merge teacher/program practice data with student outcomes to begin exploring the effective components of BLBC and ESL programs
Inference Tree Example plot of chunk parttree
R is a powerful platform • Can Standardize and Share / Compare Results • Execute the same code on each other’s data • Compare results • Compare methods of analysis and improve them • Build a professional community • Collaborate
Some code sharing exists • DPI has begun working with the Strategic Data Project at Harvard to prepare their toolkit using R • Currently written in Stata • Goal is to package the toolkit into R functions that can be applied to any dataset that has the required elements • This work has begun with the creation of a few functions in R and some documentation • Can be found online at GitHub [github.com/jknowles/SDP-Toolkit-for-R] http://www.gse.harvard.edu/~pfpie/index.php/sdp/strategic-data-project-the-vision
Race/Ethnicity Example • Consider this example data from the Strategic Data Project Toolkit: • Student 1 and Student 2 in this data have different races in different years • This doesn’t happen often in most of our data systems, but it does happen, especially across different datasets • For research this can cause problems and requires different business rules
What business rules do we use? • Ad hoc and up to the researcher • Need standards • Need commonality • Need consistency • Need tools that make those things easy to do!
What to do • Should this student be declared H, the modal race? • Should this student be declared B, the first occurring race? • Should this student be flagged as inconsistent? • Should this student be coded as multi-racial?
Fix the data • We can do the modal category easily in R using a simple function
Some code sharing exists • DPI has begun working with the Strategic Data Project at Harvard to prepare their toolkit using R • Currently written in Stata • Goal is to package the toolkit into R functions that can be applied to any dataset that has the required elements • This work has begun with the creation of a few functions in R and some documentation • Can be found online at GitHub [github.com/jknowles/SDP-Toolkit-for-R] http://www.gse.harvard.edu/~pfpie/index.php/sdp/strategic-data-project-the-vision
What happened • We implemented two business rules on over 59,000 observations in a few seconds on a few lines of code • First, the modal race is chosen for multiple race categories per student • If a tie exists (more than 1 mode), we map the most recent race • These business rules can be readily changed, i.e. we could use the first race or a multi-race code for students with multiple modes
What happened (continued) • This script can be run every time data is extracted from the warehouse to do work on • It can be run by every analyst on every machine because R is free and easy to deploy! Consistency and repeatability. • It can be swapped out with a different business rule implemented just as easily for different purposes flexibility • It can be mapped and translated onto CEDS elements
Next Steps • Once we clean up the data, analytics can be shared • Doing analytics is a simple next step in R • R has best in class machine learning algorithms used to classify data and predict • R is the tool of choice for data science algorithms
A Data Mining Example • If we are interested in pure predictive analytics, R provides hundreds of best in class algorithms and methods to evaluate them • This is done primarily through the caret package, which provides an easy to use framework for comparing these algorithms • These models can be used to predict “classes” of students, predict student scores, or predict anything else of interest
A Data Mining Example • If we are interested in pure predictive analytics, R provides hundreds of best in class algorithms and methods to evaluate them • This is done primarily through the caret package, which provides an easy to use framework for comparing these algorithms • These models can be used to predict “classes” of students, predict student scores, or predict anything else of interest
The best part • R is a programming language and can be used to produce reports • R can produce HTML, PDF, or other formats of reports • Examples: • Dropout risk reports for each high school • NSC reports by school district
The best part (II) • R can do this by simply building a template and running analytics on the appropriate data subset, automatically • R can even e-mail reports, seriously • Your data analysts have access to a full programming language once they understand R, flexibility far above and beyond other analytics packages for a slightly steeper learning curve
How to learn • Online with tutorials • DPI R Bootcamp in August • PD workshops elsewhere
Online Tutorials • Visit this presentation online and look at these great resources for learning that are free and open source as well • R Features List [www.revolutionanalytics.com/what-is-open-source-r/r-language-features/] • Video Tutorials [http://www.twotorials.com/] • R Tutorials from Around the World [pairach.com/2012/02/26/r-tutorials-from-universities-around-the-world/] • R for SPSS/SAS Users [r4stats.com/add-ons]
DPI R Bootcamp • DPI is offering a bootcamp on R August 2nd and 3rd. • Slots are limited for this two full days of R training. • Training materials will be made available online. As they are developed, they can be viewed at https://github.com/jknowles/r_tutorial_ed. • For more information, visit the website https://sites.google.com/a/dpi.wi.gov/rbootcamp/. • We will probably do another bootcamp soon, a few slots still available for this bootcamp. Interested? See me.
Session Info This document is produced with knitr version 0.6.3. Here is my session info:
Jared E. Knowles Wisconsin Department of Public Instruction Phone 608-266-3569 eMail jared.knowles@dpi.wi.gov