Download
1 / 27
270 likes | 277 Views
This study aims to evaluate and optimize the analysis error covariance by estimation of input error statistics using cross-validation. It also examines known diagnostics of analysis error covariance in active and passive observation spaces.

E N D
Diagnostic and optimization of analysiserror covariance by cross-validation Richard Ménard, Martin Deshaies-Jacques Air Quality Research Division, Environment and Climate Change Canada EnKF Data Assimilation Workshop, St-Adèle (Québec), May 2018
Evaluate the analysis error – Why ? • The analysiserrorwegetfrom an analysisscheme (e.g. perceivedanalysiserror(Daley 1992)) issimply an estimate consistent with the input errorstatistics. • The best forecast and the best analysismay not entirelyrelated • presence of model error • some important mechanismsthatleftcompletlyunobserved • the analysedfieldcould have little influence on the forecast Examples in precipitationanalysis, in chemical data assimilation Our objective • Develop a method to evaluate the trueanalysiserrorwithout a relying on a forecast • Optimize the analysiserror variance by estimation of input errorstatistics • Estimate the observation error, background error and analysiserror
Evaluation of analysis error covariance • Using cross-validation Optimization of analysis error covariance • Using cross-validation AND • Fundamentals of estimation of error covariances in observation space • Ménard, R and M. Deshaies-Jacques. Evaluation of analysis by cross-validation. Part I: Using verification metrics. Atmosphere2018, 9(3), 86, doi:10.3390/atmos9030086 • Ménard, R and M. Deshaies-Jacques. Evaluation of analysis by cross-validation. Part II: Diagnostic and optimization of analysis error covariance. Atmosphere2018, 9(2), 70; doi:10.3390/atmos9020070 AND • Ménard, R: Error covariance estimation methods based on analysis residuals: theoretical foundation and convergence properties derived from simplified observation networks. Q. J. Roy. Meteorol. Soc. 2016, 142, 257—273, doi:10.1002/qj2650 Related paper • Marseille, G.-J., J. Barkmeijer, S. de Haan and W. Verkely. Assessment and tuning of data assimilation systems using passive observations. Q. J. Roy. Meteorol. Soc.2016, 142, 3001-3014, doi:10.1002/qjt2882
Known diagnostics of analysis error covariance • Observations divided into • Active sites used to construct the analysis) • Passive sites (or cross-validation) used only to evaluate the analysis is the observation operator for the active sites is the observation operator for the passive (independent) sites Diagnostic in active observation space Hollingsworth-Lönnberg 1989 Desroziers et al. 2005 Diagnostic in passive observation space Marseille et al. 2016
Diagnostics: A geometric view Hilbert spaces of random variables Define an inner product of two (zero-mean) random variables X , Y as Uncorrelated random variables X , Y represented as orthogonal vectors Standard deviation is represented as the norm of the vector O A T B
Diagnostics: A geometric view Hilbert spaces of random variables Define an inner product of two (zero-mean) random variables X , Y as Uncorrelated random variables X , Y represented as orthogonal vectors Standard deviation is represented as the norm of the vector O T B
Diagnostics: A geometric view obs and background errors are uncorrelated active and independent obs. errors are uncorrelated
Diagnostics: A geometric view Marseille et al. 2016 true analysis error covariance
Diagnostics: A geometric view c by varying the observation weight while we can find a true optimal analysis
Diagnostics: A geometric view Hollingsworth-Lönnberg 1989
Diagnostics: A geometric view Ménard-Deshaies-Jacques 2018
Diagnostics: A geometric view Desroziers et al. 2005 Geometrical proof given in Ménard and Deshaies-Jacques 2018
Diagnostics: A geometric view Diagnostic in passive observation space we get The yellow triangle we have and using we get the relation above
Estimation Theorem on estimation of error covariances in observation space Assumingthat observation and background errors are uncorrelated, the necessaryand sufficent conditions for error covariance estimates to beequal to the true observation and background error covariances are: • Optimal analysis in the observation spaceis NOT sufficient to estimate • the trueanalysiserror covariance or the true observation and background error • (in observation space) covariances • Diagnostic of the Kalman gain condition • Daley 1992 (MWR) suggestedthat the time lag-innovation covariance • to beequalzero (assuming observation errors are seriallyuncorrelated) • Herewesuggest to use cross-validation
Estimation • Spread skill in EnKF • A scalar version of this condition is or • Simple interpretationwith a scalarproblem • Innovation consistencysaysthat the sum of observation and background • error variances is the sum of the trueerror variances • 2) Kalman gain condition saysthat the ratio of observation to background • error variance is the ratio of the trueerror variances
Cross-validation (k-fold) k=3 spatially random distributed set of observations Real-time surface ozone observations
Passive /independent obs. Active obs. • Analyses constructed with uniform background and observation error variances • Vary the ratio while keeping the sum
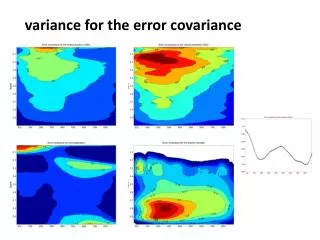
Application to O3 surface analysis iter 0 (first guess error correlation) Iter 1 (Maximium Likelihood estimation of correlation length) Input error statistics incorrect correlation length Estimate of analysis error variance at passive observation sites correlation length by ML Estimation of active analysis error variance
Analysis error variance (computed from the analysis scheme i.e. perceived analysis error variance)
Error of representativeness Experiment: All data / removing passive data close to active sites Table 1. Estimation of the representativeness error variance • The estimated background error variance is nearly the same in both experiments; small difference of only 2% • The estimated observation error is smaller by 18% when we filter out the nearby observations. • The difference in error variance indicated that the representativeness error variance for PM2.5 observations is about 2 μgr/m3 (consistent with high resolution studies)
Satellite observation error by cross-validation ? Oi set of independent spatially uncorrelated errors Os satellite observation with correlated errors with the background • Cross-validation analyses with all Osat and 2/3Oi that we evaluate againts1/3Oi and get the optimal analysis. • Then apply the HL using the satellite observation operator on the optimal analysis to obtain for EnKF by construction creates a symmetric positive definite • Iteration on those two step may be necessary
Summary • With passiveobservations that have uncorrelated errors with the active observations and background errors we can • Estimate the true analysis error variance (even if active obs and background errors are correlated) • Optimize error variance parameters to obtain the best true analysis • True optimal analysis can be obtained with two conditions • Minimizing the analysis error • Innovation covariance consistency • We have introduced a new diagnostic of analysis error covariance that works in both active and passive observation sites • When optimization AND innovation consistency is achieved all estimates of analysis error variances (active and passive sites) agrees • Estimates of observation representativeness error can also be obtained • Next step to apply this methodology to satellite observations
Verification of analysis by cross-validation: when active observation and background errors are correlated
Verification of analysis by cross-validation: when active observation and background errors are correlated The HL and MDJ diagnostic continue to be valid but not the D diagnostic
Verification of analysis by cross-validation: when active observation and background errors are correlated O so q sb B T