Download

1 / 55
550 likes | 576 Views
ECONOMIES OF AGGLOMERATION. ECONOMIES OF AGGLOMERATION. Density generates costs Higher cost of land Greater congestion, higher commuting and transport costs Population and economic activity are ever more concentrated in cities There must be offsetting benefits Higher productivity for firms

E N D
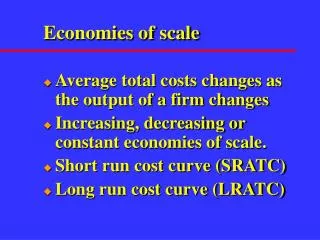
ECONOMIES OF AGGLOMERATION • Density generates costs • Higher cost of land • Greater congestion, higher commuting and transport costs • Population and economic activity are ever more concentrated in cities • There must be offsetting benefits • Higher productivity for firms • Higher wages for workers • Are these advantages due to agglomeration economies? • What are their scale and scope and causes?
Why is it profitable for firms to concentrate employment? • Plant-level economies of scale • Plants produce more efficiently at a larger scale • Agglomeration economies • Plants produce more efficiently when close to other plants • Urbanization economies • when close to other plants in general • Localization economies • when close to other plants in the same industry
Economies of agglomeration are externalities • A person who is making an economic decision, such as whether to produce more output, makes the decision on the basis of his own marginal costs and benefits, and ignores costs or benefits that affect others • An example • An industry in an urban area: demand, D and supply, S • Made up of a large number of small, competitive firms • Each of these firms has a lon-run average cost curve that has a minimum point at some level of output • In the long run the output of the industry expands by adding more firms • The long-run supply curve of the industry is the horizontal line S • The market price is set equal to long-run average and marginal curve
Economy external to the firm but internal to the industry: The expansion of the industry output, through the addition of another firm, will lower the average costs for the other firms The price at which the firms in the industry will offer the good now drops to the lower average cost
MICRO-FOUNDATIONS OF AGGLOMERATION ECONOMIES • Sharing. • Matching. • Learning.
1. SHARING • Sharing indivisible facilities • Simplest argument to justify the existence of a city • Example: ice hockey rink • Expensive facility with substantial fixed costs • Few individuals would hold a rink for themselves • An ice hockey rink is a an indivisible facility that can be shared by many users • Factory towns
Sharing the gains form the wider variety of input suppliers that • can be sustained by a larger final goods industry • C. Sharing the gains from the narrower specialisation that can be sustained with larger production
Model of gains from diversity Productive advantages of sharing a wider variety of differentiated intermediate inputs produced by a monopolistically competitive industry ↓ Aggregate returns to scale There are sectors In each sector, perfectly competitive firms produce goods for final consumption under constant returns to scale They use intermediate inputs, which are specific to each sector and enter into plants’ technology with a constant elasticity of substitution The higher the lower the elasticity of substitution
Intermediates produced in monopolistic competititon Production is explained by: Increasing returns is the marginal productivity of labor is a fixed cost Profit maximizing price Long-term equilibrium
Number of firms in equilibrium: Applying normalizations: An increase in final production by virtue of sharing a wider variety of intermediate suppliers requires a less than proportional increase in primary factors
Gains from specialization Consider a perfectly competitive industry in which firms produce a final good by combining a variety of tasks that enter into their technology with a constant elasticity of substitution The number of tasks is fixed Each atomistic worker is endowed with one unit of labour. Any worker allocating an amount of time l(h) to perform task h produces Parameter of productivity Intensity of the gains from specialization
Note that l(h) can be interpreted as a measure of specialization, since the more time that is allocated to task h the less time that is left for other tasks. L workers and tasks each worker devotes of her unit labor endowment to each of the tasks she performs
2. MATCHING Improvingthequality of matching Matchingmodelwthtwosources of agglomerationeconomies: Anincrease in theumber of agentstryingto match improvestheexpectedquality of each match 2. Strongercompetitionhelpstosave in fixedcostsbymakingthenumber of firmsincreaselessthanproportionatelywiththelabourforce
Industry with an endogenously determined number of firms Tecnology of each firm: Firms produce a homogeneous good final good (numeraire) but Horizontally differentiated skill requirements Continuum of workers with heterogeneous skills (each worker supplies a unit of labor) No perfect match cost of mismatch borne by the worker Each firm posts a wage so as to maximize its profits Each worker gets a job with the firm that offers him the highest wage net of mismatch costs The skill space is taken to be the unit circle
Firms’skill requirements are evenly spaced Workers’ skills are uniformly distributed with density equal to the labour force, L The cost of mismatch is (is the distance from workers’ skill to skill requirement of employer) nfirms simmetrically located, all offer the same wage Firms compete for workers (full employment) Each firm will have two competitors only Skill requirements are at a distance left and right
A worker located at z from firm h is indiferent between h and the closest competitor Firm h will hire workers whose skill is within distance z to its skill requirement By offering a higher wage than its competitors a firm can increase its workforce above its proportional labour market share
The profts of the firm are: monopsony power Equilibrium wage: By paying its workers below its marginal product, each firm offsets its fixed cost Entry reduces firm profits for two reasons: 1- Workers get split between more firms (market crowding effect) 2- Entry intensifies competition amongst firms for workers, forcing to lower wage margin (competition effect)
Free entry Aggregate production Increasingreturns due to competition between firms: As the workforce grows, the number of firms increases less than proportionately due to greater labour-market competition Then each firm ends up hiring more workers In the presence of fixed costs, this increases output per worker
From output to income per worker: We need to incorporate mismatch costs The average worker has a skill that differs from it’s employer requirement by Then the average mismatch is Subtracting the average mismatch costs form output per worker gives average income per worker Increase with the size of the labour force not only for the previous effect but also because a matching externality: As the workforce grows and the number of firms increases the average worker is able to find an employer that is a better match for its skill
3. LEARNING The Obligatory Marshall Quotation When an industry has thus chosen a locality for itself, it is likely to stay there long: so great are the advantages which people following the same skilled trade get from near neighbourhood to one another. The mysteries of the trade become no mysteries; but are as it were in the air, and children learn many of them unconsciously. Good work is rightly appreciated, inventions and improvements in machinery, in processes and the general organization of the business have their merits promptly discussed: if one man starts a new idea, it is taken up by others and combined with suggestions of their own; and thus it becomes the source of further new ideas. Alfred Marshall. 1890. Principles of Economics. London: Macmillan. Book IV, Ch. X, § 3: The advantages of localized industries; hereditary skill.
Cost and output for an industry Dynamic agglomeration economies
Three Types of Externalities (Glaeser et al. 1992) 1. Marshall-Arrow-Romer Local knowledge spillovers between firms in the same industry Specialization and concentration promote growth • Local monopoly helps growth by internalizing externalities 2. Porter Innovation in competitive industry clusters with many small firms Specialization and fragmentation promote city growth • Local competition requires firms to innovate or die 3. Jacobs Local knowledge transfers across industries Diversification and fragmentation promote city growth • “Cross-fertilization” of ideas across different lines of work
Evidence not conclusive • Glaeser et al. (1992) find evidence of Jacobs externalities explain the employment growth of sector-city • Henderson et al (1995) find that new industries appear in diverse cities but mature industries grow in specialized cities.
Nursery cities (Duranton and Puga, 2001) • Consider a firm that is looking for the ideal production process for a new product • By experimenting with different processes, the firm will find the ideal process • Once found the ideal process, the firm will switch to mass production and start earning a profit • Question is: where should the firm experiment, in a diverse city or a specialized city?
Cost and Benefits of both options (model) • First option → experiment in a diverse city and then move to a specialized city after discovering the ideal process • An experiment entails producing a prototype of the firm’s new product with a particular production process • Suppose there are six processes in the diverse city • Once the prototype from the ideal process is finished, the firm will immediately recognize that it has discovered the ideal process • Assume that it takes on average three years • Once discovered the ideal, the entrepreneur will move to a specialized city and start making profits
Cost of each prototype = $4 (losses of the firm each year of the 3 year) • Year 4 the firm moves to specialized city. Moving cost = $7 • Assume firm operates 6 years • Last 3 years the firm earns a gross profit = $12 • Firm’s lifetime profit is Net profit = Gross profit – Prototype cost – Moving cost Net profit = $36 – $12 – $7 = $17
Second option → search for the process in the specialized city • Advantage → lower prototype cost Each specialized city has the specialized inputs for one production process Suppose, prototype cost = $3 · 3 years = $9 • Disadvantage → Higher moving cost The search for the ideal process would require moves from one specialized city to another An average of three moves, moving costs = $7 · 3 years = $21 Net profit = $36 - $9 - $21 = $6 • Profit is lower when experimenting in specialized cities • Different roles of diverse and specialized cities
Externalities of human capital Lucas (1988): “Most of what we know we learn form other people. We pay tuition to only a few of these teachers, either directly or indirectly by accepting lower pay so we hang around them, but most of it we get for free, and often in ways that are mutual- without distinction between student and teacher” • The productivity of individual workers is enhanced by an environment of high human capital • Labor and education policy • Social returns to skill > private returns to skill • Education as a public good • Rationale for vast government intervention • Endogenous growth theory • Lucas (1988) allows a country’s average human capital to increase TFP
Standard approach to the analysis of human capital externalities An economy with workers i or j, living in cities a. The social output of worker i with human capital hi and living in city a is given by: A is a technological parameter independent of location and Bais a city specific parameter. The earnings of this worker are: Reciprocal externality
Assume that worker i’s human capital directly benefits N other workers in the city by an amount At the same time, worker i also benefits from the human capital investment made by all other workers in the interaction group. Summing across all workers j part of the interaction group of worker i: Where is the average human capital in city a and N is the size of the interaction group. So we can write now:
MEASURING ECONOMIES OF AGGLOMERATION • Agglomeration economies imply that firms located in an agglomeration are able to produce more output with the same inputs The most natural and direct way to quantify agglomeration economies is to estimate the elasticity of some measure of average productivity with respect to some measure of local scale, such as employment density or total population
MODELING APPROACHES • Production Function The most natural and direct way to measure economies of agglomeration Fundamental challenge is to find data on all inputs The easiest to find: - Employment/Hours of work The rest not so easy: - Physical capital - Land - Materials (purchased by the firm not made by the firm)
Measures of A(s sector, c city) - Size of employment (nº de firms) from firm’s industry in the city (economies of localization) - Size of employment or population of the city (economies of urbanization) - Employment density - Measures of specialization of city in sector or - Measures of industrial diversity of the city
Wages • Assumption: • In competitive markets • Even without perfect competition, in more productive locations, wages will be higher • Economies of agglomeration Higher productivity Higher wage • Microdata on wages increasingly available
Births of new establishments Assumption: Entrepreneurs seek out profit-maximizing locations and are disproportionately drawn to the most productive regions Economies of agglomeration Higher productivity Higher profit Location decision No need of data of purchased inputs New establishments are largely unconstrained by previous decisions Decisions are made taken as exogenous the existing economic environment
Employment Growth Assumption: Agglomeration economies enhance productivity and productive regions grow more rapidly as a result Economies of agglomeration Higher productivity Shift labor demand Employment growth Data on employment easily available
DETERMINANTS OF LOCAL PRODUCTIVITY We will see how can be derived an estimable equation relating productivity/wage and agglomeration economies, taking as a departure point a production function • We assume a firm j • Located in r • Operating in sector s • Using labor in quantity • And other factors • Production function given by: • is the proportion of labor in production • is a Hicks-neutral factor augmenting technology level • is the efficiency level of workers
Profit of the firm: is the quantity exported to region b, is the mill price set in region b net of the marginal cost of intermediate inputs, is the average unit value, net of the cost of the intermediate inputs is the wage rate is the cost of inputs other than labor and intermediate inputs is the value added of the firm (Value of production minus cost of intermediates)
Applying FOC and rearranging terms: By plugging the second expression into the first, we obtain: By aggregating: is the number of firms in region r and sector s
In which region is the marginal productivity of labor the highest? The equation shows that wages are directly proportional to workers’ efficiency, This has to do with workers’ endowments but not with space Still we have through which agglomeration effects show up • A higher , because of high demand, weak competition or cheap intermediates, positively affects wages and worker attraction contributing to a higher degree of agglomeration in the region. • captures the effects transmitted through other factor prices. When production factors have a low supply elasticity (e.g., land), prices will be higher in agglomerated areas, which pushes down the wage rate and are affected by pecuniary externalities that work through market mechanisms
Technological externalities are taken into account through Regions with easy circulation of information and/or high concentration of skilled workers are likely to benefit from more productive technologies, then higher wages. Conversely, transport congestion or pollution worsen productivity and wages Alternatively, if data related to value-added and capital stocks are available:
ECONOMETRIC ISSUES We regress the total factor productivity, average labor productivity or nominal wage on the employment or population density. We can use logs to interpret the coefficient directly as an elasticity where Estimating the above equation is equivalent to estimate: • Implicit assumption: Density affects wage level through: the local level of technology, ; the output price, ; the prices of other inputs, ; the local efficiency of labor, Not able to determine through which variables. Only the net effect of density is identified But this still relevant for policies designed to concentrate or disperse activities
Omitted variables • Skills Differences of skill across space partly explain productivity differentials Not controlling for average regional skill levels labor skills are randomly distributed across regions and captured by the error term If skill controls are not introduced: If denser areas are more skilled, the effect of density will be overestimated
Intra and Inter-sectorial externalities Wage varies by region and sector but density only varies by region Industrial mix should be controlled Industrial mix is important where: • output is sold to a small number of industries • inputs used are industry specific it affects the level of productivity through price effects specialization index captures intraindustry externalities For interindustry externalities, an “industrial diversity” variables is included (Herfindhal index)
Natural amenities and local public goods Amenities: • Naturals: favorable climate, coast-line location, presence of lakes and mountains, natural endowments in raw materials • Man-made: the result of public policy like leisure facilities (theaters, swimming pools,…) or public services (schools, hospitals,…) Local Public Goods → benefits reaped by local consumers LPG can be used by firms: Transport infrastructures, research laboratories, job training centers LPG can affect productivity of production factors If randomly located → captured by Problem: Supply of LPG greater in areas characterized by concentrated activity (public policy decisions) Consequence: overestimation of density effect
But amenities may have additional effects On the supply side: If a region has amenities that attract population → Upward pressure on demand for housing →Pushing up rents On the demand side: Higher land rents → Higher cost for firms → Substitute other production factors, labor, for land → Marginal productivity of labor decreases → Drop in wages If natural amenities are more abundant in heavily populated regions (e.g., leisure facilities) the effect of density is underestimated