Download
1 / 16
160 likes | 169 Views
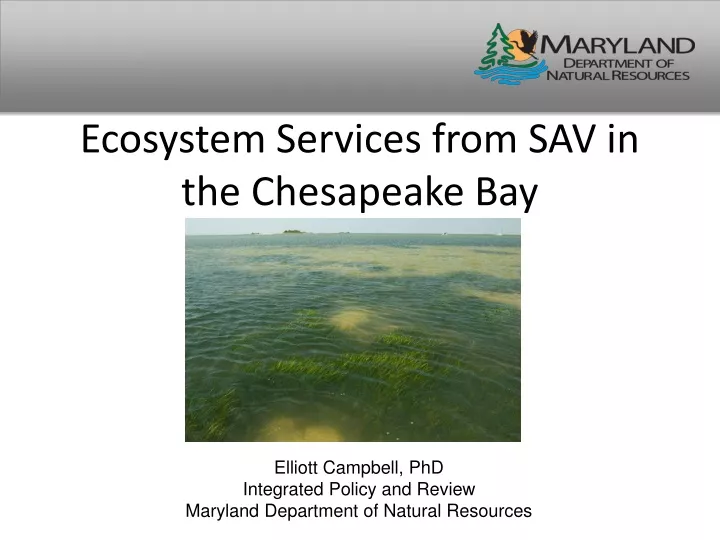
Ecosystem Services from SAV in the Chesapeake Bay. Elliott Campbell, PhD Integrated Policy and Review Maryland Department of Natural Resources. What Are Ecosystem Services?. “Benefits gained by people from the environment”. As classified by the Millennium Ecosystem Assessment (MEA 2005).

E N D
Ecosystem Services from SAV in the Chesapeake Bay Elliott Campbell, PhD Integrated Policy and Review Maryland Department of Natural Resources
What Are Ecosystem Services? “Benefits gained by people from the environment” As classified by the Millennium Ecosystem Assessment (MEA 2005)
SAV Ecosystem Services What benefits do SAV provide compared to typical bay bottom? • Higher rates of net primary production • Stabilization of sediment and reduction of incoming wave energy • Carbon sequestration • Nitrogen sequestration • High production of blue crabs and other fish species
Methodology: Eco-Price • We measure what the ecosystem does • Carbon is taken up • Shoreline is protected • Nutrients are taken up • Habitat is provided • We look at what we have paid for that service (Price Signals we term Eco-Prices) • In a market • Treatment and restoration costs • Through mitigation fees • Cost to regulate
Methodology • Broke down each service by density of the SAV bed • Used same density classes as the VIMS survey • 0-10% (5% midpoint) • 10-40% (25% midpoint) • 40-70% (55% midpoint) • 70-100% (85% midpoint) • Assumed the ES is linearly related w/ % cover (for carbon and nitrogen)
Carbon Eco-Price: $24 per mt Carbon Key Ref.: Wyda et al. 2002, Moore 2004, Greiner et al. 2013, Duarte et al. 2013
Nitrogen Key Ref.: Kemp et al. 2005 Eco-Price: $18.33 per kg N
Blue Crab Production Dockside value of $2.40 per kg (NOAA) Key Ref.: Ralph et al. 2002
Other Commercial Fish Production Key Ref.: Orth 1984, Sobocinski 2014 Dockside value of $5.00 per kg (NOAA)
Shoreline Stabilization • Not all SAV provides shoreline stabilization • Literature (Newell and Koch 2004, Koch et al. • 2009) suggests importance of • SAV density • Height of SAV canopy • SAV species • Wave intensity • Depth of water column • Type of shoreline • All factor in to the degree to which SAV protects • The coast • To be conservative we only included the highest • Density class (4) within 500 m of the shore and • Assumed these beds absorb 20% of incoming • Erosive wave energy over 2/3 of year
2015 Survey • Increase of 2570 ha, ~ $2.4 million per year Total ES Value $50,375,412 (w/o shoreline stabilization)
Questions • Methane production in tidal fresh/oligohaline SAV? • Rule of thumb for shoots/m2 to % cover? • Better way to estimate fish production? • Better model for coastal protection? • Did not include replacement cost of SAV bed Email: elliott.campbell@maryland.gov