Download
1 / 30
300 likes | 460 Views
Ecosystem State Change in Chesapeake Bay. Mark Trice – MDDNR Dave Jasinski – UMCES/CBP. Definition. If an ecosystem is defined by its trophic structure then a state change would involve a shift in the transfer of energy through that structure.

E N D
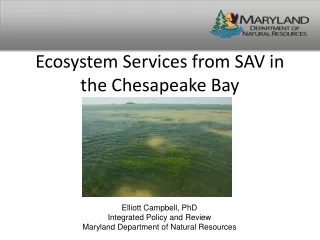
Ecosystem State Change in Chesapeake Bay Mark Trice – MDDNR Dave Jasinski – UMCES/CBP
Definition • If an ecosystem is defined by its trophic structure then a state change would involve a shift in the transfer of energy through that structure. • This would be a deviation from steady state or attainment of a new steady state?
State change would be evidenced by: • A shift in species composition and distribution along the trophic cascade from producers to consumers • A change in ecosystem function • A change in or lessening of the systems resilience to stressors
Management implications • Fisheries – are we moving towards and aquaculture based fishery? • Living resources – will non-natives be the new natives? • Water quality – do we need to shift FROM trying to get back to the old days TO holding the line? Are currently living in the futures “Good Old Days”?
Observed evidence for state change • Decreasing water clarity with time independent of flow or input • Lack of SAV recruitment • Lack of oyster recruitment • Changed fisheries – increase in pelagics, decrease in sessile and benthics. • Shifting planktonic structure • More hypoxia per pound of N
Chlorophyll in York Data courtesy of Ken Moore
TSS in York Data courtesy of Ken Moore
Eelgrass and Temperature (2005) 2005 – vs average of Prior 3 years
SAV bed density at Gloucester Point, VA Image courtesy of Ken Moore
Additional Points from Ken • Lack of SAV stress tolerance due to turbidity; plants can’t photosynthesize enough to cope • Light quality also declining – Eastern shore vs. Bay recruitment • Fresh water areas showing resurgence. Seems to be driven by colonizers
Only about 1-2% of Spatial Area is Passing the deeper 1-2 meter PLL/Light Attenuation criteria April 2004 May 2004 June 2004 July 2004 Aug 2004 Sept. 2004 Oct. 2004 Passes at 2.1 PLL Passes at 1.0 PLL Fails 2.1 PLL
Using The Chesapeake Bay Fisheries Ecosystem Model (CBFEM) to Explore Possible State Changes in the Ecosystem Howard Townsend NOAA Chesapeake Bay Office
CB Fisheries Ecosystem Model Developed in cooperation between NOAA Chesapeake Bay Office & Cooperative Oxford Lab, Chesapeake Research Consortium, University of British Columbia with support from many bay researchers A companion to the CB Fisheries Ecosystem Plan Technical report (230 p) completed/in review Chesapeake Bay tidal waters 45 functional groups Replicates ecosystem history 1950 – present More info at: http://noaa.chesapeakebay.net/ecosystemmodel.aspx
Model drivers • Nutrient loading • Fishing mortality • Catches • Effort • Challenge: • Long time series
Striped Bass Biomass/Original Biomass Menhaden Blue Crab Oyster 1950 2002 Potential shift from benthic-dominated to pelagic-dominated system? • Historical increase in striped bass, menhaden and blue crab, but decline in recent years • Historical decline in oysters • Suggests that declining water quality had: • rapid effects on oyster stocks, • initial positive effects on some commercially important species, but decline in recent years • May be indicative of different response thresholds to declining water quality for different species *Caddy’s three stages of Eutrophication effects.
Striped Bass under current conditions Striped Bass if nutrient loading reduced in 1980s to 1970s levels Biomass/Original Biomass 2002 1950 • With finfish, bottom-up effects (e.g., nutrient loading) can be confounded with top-down effects (e.g., fishing pressure), so phase shifts can be difficult to detect • Potential shift from benthic-dominated to pelagic-dominated system was aided by increased nutrient loading and changes in fisheries management
But a recent article in the journal Science concluded that cow-nosed rays have become "hyperabundant" in recent years because of overfishing of sharks in the Atlantic Ocean.More than 90 percent of the sharks are gone, slaughtered so their fins can be sold in Asia as a delicacy and aphrodisiac. This has thrown the ecosystem out of balance, allowing their prey, rays, to multiply perhaps 20-fold since the 1970s, to about 40 million today in the Chesapeake Bay, according to the article. If we take an ecosystem and knock off the equivalent of lions and tigers and wolves at the top, is there a consequence?" asked Charles H. Peterson, a University of North Carolina professor and one of the authors. "We discovered that the cow-nosed rays and other prey have increased dramatically."Rays devour as much as 840,000 metric tons of oystersand shellfish a year in the bay - more than 2,000 times the amount caught by commercial watermen, according to the Science article. And the native oyster population is already depleted because of overfishing, parasites and pollution.Some efforts to plant new oysters have been overwhelmed by rays. In May 2006, a swarm of cow-nosed rays gobbled 775,000 oysters planted by the Chesapeake Bay Foundation on an artificial reef. Baltimore Sun, Sept 1 2007 Rays – Another indicator of Trophic Changes
Algal species composition changes/HABs Microcystis aeruginosa Karlodinium micrum Alexandrium spp – 2007 Occurrence Prorocentrum minimum
Ratio of Pelagic to Demersal fish in Chesapeake Bay Many, many factors to be considered – fishing pressure, changing tastes, climatic variability, etc… From: Kemp et al, 2005
Increased Bacteria Bacterial carbon from sediment cores From: Kemp et al, 2005
Increased hypoxia per unit N • Loss of SAV and Oysters which retain nutrients and organic matter in shallow waters • Loss of denitrification and P precipitation From: Kemp et al, 2005
Possible trajectories From: Kemp et al, 2005
Do multiple stressors have an additive or multiplicative effect? • Shoreline structures • Impervious surfaces • LULC • Climate change/sea level rise • Trophic changes • Eutrophication
Piscataway Watershed 19.5% Impervious Bohemia Watershed 2.5% Impervious Does impervious surface reduce resiliency?