Download
1 / 19
190 likes | 317 Views
Geospatial Mapping of Coastal Communities of Alabama: Value Created by Collaboration. EDA Grant #: G004824. Problem Statement. Hurricane storm surge and wash of sand and debris inland frustrates clean-up effort Heavy Equipment damages fixtures covered by debris and sand

E N D
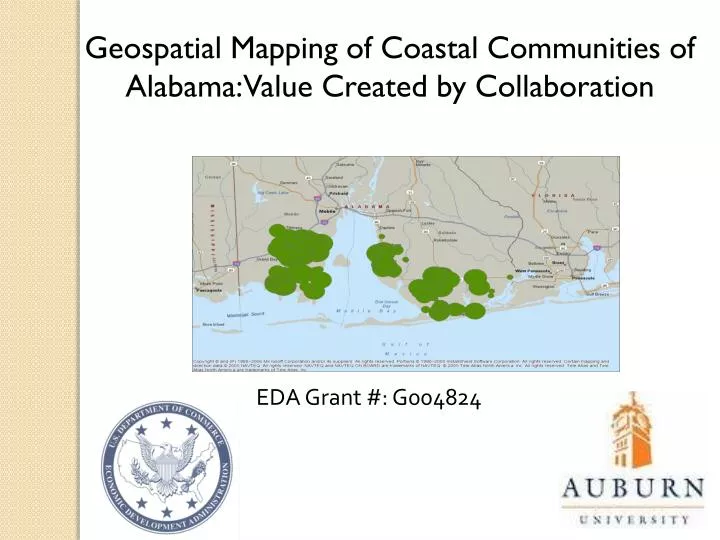
Geospatial Mapping of Coastal Communities of Alabama: Value Created by Collaboration EDA Grant #: G004824
Problem Statement • Hurricane storm surge and wash of sand and debris inland frustrates clean-up effort • Heavy Equipment damages fixtures covered by debris and sand • $9 billion spent by federal government in mitigation efforts since 1998 • 50% or more of the damage inflicted on critical utilities during the clean-up effort
Current Condition Each utility company has print or electronic maps in different formats Little coordination during clean-up effort No information sharing system in place to deliver plans to clean-up personnel
Scope of Project: Baldwin County Coastal Area + Industry Clustures
Project Team: Two year project Chetan S Sankar, Amit Mitra David Mixson, Walker Jackson P.K. Raju Steve Henderson, Diane Brown Barry Cumbie
Model for the Project: Co-Creation of Value by Effective Collaboration
Mapping the Coastal Communities of Alabama 27 Auburn University Students Collect Infrastructure Facilities Data in Gulf Shores, Orange Beach, & Dauphin Island January – April 2010
Training Provided to Students Prior to Being Deployed at Site • Student workers were provided hands on training from team leaders on how to use the Topcon-GMS2 units • Student workers were provided instruction manuals on the units to reference while working in their groups of two. • Lastly, student workers were provided an icons list, so they could easily identify infrastructure elements while working on site.
Data Collection at Gulf Shores During Week One (Feb. 19-21) • Team leaders: Darrell Rigsby and SatishKutchi • Student Workers: (Team 3) Sarah Tway, Mark Stevenson, John Neubauer, Grant Martin and Tim Ledlow (Team 5) Andy Dyer, David Rose, Michael Porter and John Davenport Data Points Collected: 605 Walking Miles Covered: 4
Data Collection during Week Two (Feb. 26-28) at Gulf Shores • Team leaders:Darrell Rigsby, Satish Kutchi and Kati Jones • Student workers: (Team1) Kanesha Belyue, Caitlin Duff, Carter Rice and Alex Johnson (Team 4) Tyler Gibson, Grant Moore, Lauren McManus and Sara Yousey (Team 6) Milaika Pickard, Drew Turner, Eric Hirstein and Satish Kutchi Data Points Collected: 1592 Walking Miles Covered: 9.16
Data Collection During Week Three (March 5-7) at Gulf Shores • Team Leaders:Darrell Rigsby and Kati Jones • Student Workers: (Team1) KaneshaBelyue, Caitlin Duff, Carter Rice and Alex Johnson (Team 3) Sarah Tway, Mark Stevenson, John Neubauer, Grant Martin and Tim Ledlow (Team 6) Milaika Pickard, Drew Turner, Eric Hirstein and SatishKutchi Data Points Collected: 1950 Walking Miles Covered: 10.5
Data Collection during Week Four (March 26-28) at Gulf Shores & Orange Beach • Team Leaders:Darrell Rigsby and Kati Jones • Student Workers: (Team 4) Tyler Gibson, Grant Moore, Grant Martin, Lauren McManus and Sara Yousey (Team 5) Andy Dyer, David Rose, Michael Porter and John Davenport Data Points Collected: 1692 Walking Miles Covered: 9.00
Data Collection During Week Five (April 10-12) at Orange Beach • Team Leaders:SatishKutchi • Student Workers: (Team 3) Sarah Tway, Mark Stevenson, John Neubauer, Grant Martin and Tim Ledlow (Team 4) Tyler Gibson, Grant Moore, Lauren McManus and Sara Yousey (Team 6) Milaika Pickard, Drew Turner, Eric Hirstein and SatishKutchi Data Points Collected: 1914 Walking Miles Covered: 11.0
Data Collected So far in the Project Data Points Collected: 7,753 Walking Miles Covered: 43.67 Total Manhours: 450
Future Plans • 2 more weeks of data collection during April by 5 teams • Data collection by a smaller team during summer & fall • Upload data to Virtual Alabama • Provide data to city & utilities • Develop training materials • Train appropriate personnel on use of GMS-2 units & retrieve data
Benefits: Student Learning • Students get to work with GIS technologies • Give back to community • Learn ArcGIS and other technologies • Improve communication skills • Improve team working skills • Enhance leadership skills
Benefits: Advance Productivity, Innovation, & Entrepreneurship 40% of reconstruction costs can be eliminated if geospatial data are available on-line Time to recover from damage is expected to be halved due to the availability of these data Will make economic impact of this project very attractive The concept of geospatial mapping of a coastal area is innovative; Project team members learn to apply theories learned in class to solve a practical problem