Download
1 / 1
10 likes | 131 Views
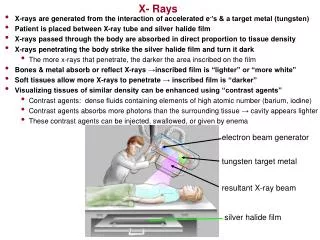
Charge Diffusion Measurement in Fully Depleted CCD using X-rays. Ivan Kotov, J. Frank, A. Kotov, P. Kubanek , P. O’Connor , V. Radeka, P. Takacs Brookhaven National Laboratory, USA Institute of Physics, Academy of Sciences, Czech Republic.

E N D
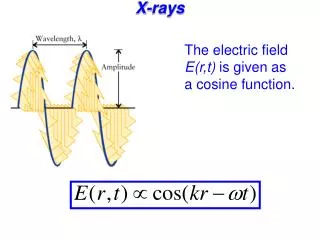
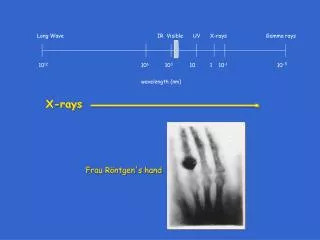
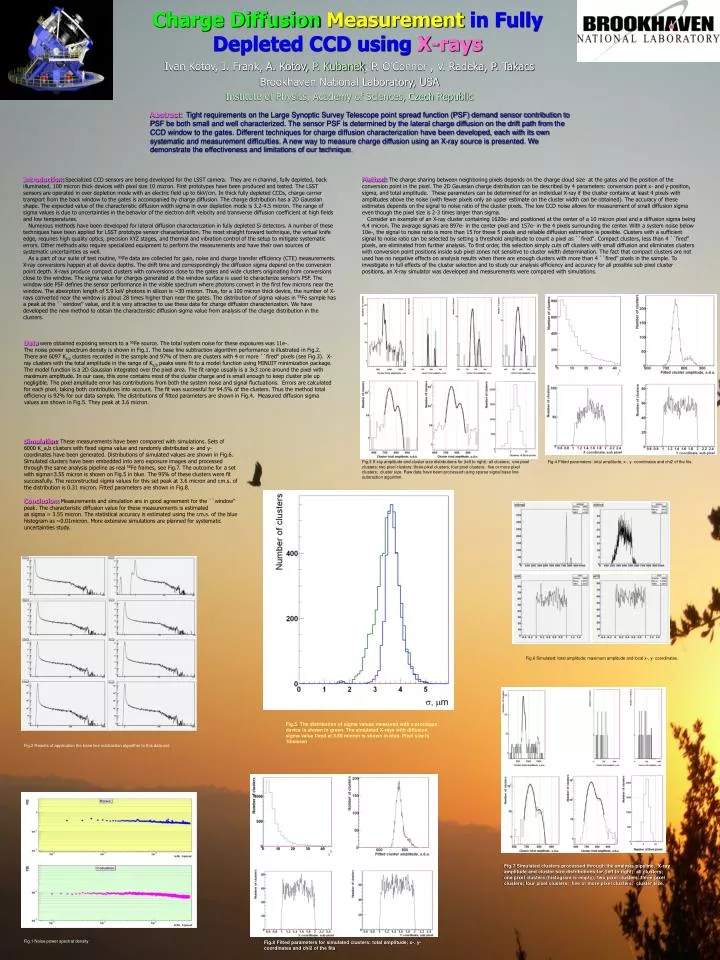
Charge DiffusionMeasurementin Fully Depleted CCD usingX-rays Ivan Kotov, J. Frank, A. Kotov, P. Kubanek, P. O’Connor , V. Radeka, P. Takacs Brookhaven National Laboratory, USA Institute of Physics, Academy of Sciences, Czech Republic Abstract: Tight requirements on the Large Synoptic Survey Telescope point spread function (PSF) demand sensor contribution to PSF be both small and well characterized. The sensor PSF is determined by the lateral charge diffusion on the drift path from the CCD window to the gates. Different techniques for charge diffusion characterization have been developed, each with its own systematic and measurement difficulties. A new way to measure charge diffusion using an X-ray source is presented. We demonstrate the effectiveness and limitations of our technique. Introduction:Specialized CCD sensors are being developed for the LSST camera. They are n-channel, fully depleted, back illuminated, 100 micron thick devices with pixel size 10 micron. First prototypes have been produced and tested. The LSST sensors are operated in over depletion mode with an electric field up to 6kV/cm. In thick fully depleted CCDs, charge carrier transport from the back window to the gates is accompanied by charge diffusion. The charge distribution has a 2D Gaussian shape. The expected value of the characteristic diffusion width sigma in over depletion mode is 3.2-4.5 micron. The range of sigma values is due to uncertainties in the behavior of the electron drift velocity and transverse diffusion coefficient at high fields and low temperatures. Numerous methods have been developed for lateral diffusion characterization in fully depleted Si detectors. A number of these techniques have been applied for LSST prototype sensor characterization. The most straight forward technique, the virtual knife edge, requires high quality optics, precision XYZ stages, and thermal and vibration control of the setup to mitigate systematic errors. Other methods also require specialized equipment to perform the measurements and have their own sources of systematic uncertainties as well. As a part of our suite of test routine, 55Fe data are collected for gain, noise and charge transfer efficiency (CTE) measurements. X-ray conversions happen at all device depths. The drift time and correspondingly the diffusion sigma depend on the conversion point depth. X-rays produce compact clusters with conversions close to the gates and wide clusters originating from conversions close to the window. The sigma value for charges generated at the window surface is used to characterize sensor's PSF. The window side PSF defines the sensor performance in the visible spectrum where photons convert in the first few microns near the window. The absorption length of 5.9 keV photons in silicon is ~30 micron. Thus, for a 100 micron thick device, the number of X-rays converted near the window is about 28 times higher than near the gates. The distribution of sigma values in 55Fe sample has a peak at the ``window'' value, and it is very attractive to use these data for charge diffusion characterization. We have developed the new method to obtain the characteristic diffusion sigma value from analysis of the charge distribution in the clusters. Method:The charge sharing between neighboring pixels depends on the charge cloud size at the gates and the position of the conversion point in the pixel. The 2D Gaussian charge distribution can be described by 4 parameters: conversion point x- and y-position, sigma, and total amplitude. These parameters can be determined for an individual X-ray if the cluster contains at least 4 pixels with amplitudes above the noise (with fewer pixels only an upper estimate on the cluster width can be obtained). The accuracy of these estimates depends on the signal to noise ratio of the cluster pixels. The low CCD noise allows for measurement of small diffusion sigma even though the pixel size is 2-3 times larger than sigma. Consider an example of an X-ray cluster containing 1620e- and positioned at the center of a 10 micron pixel and a diffusion sigma being 4.4 micron. The average signals are 897e- in the center pixel and 157e- in the 4 pixels surrounding the center. With a system noise below 10e-, the signal to noise ratio is more than 15 for these 5 pixels and reliable diffusion estimation is possible. Clusters with a sufficient signal to noise ratio can be selected by setting a threshold amplitude to count a pixel as ``fired''. Compact clusters, less than 4 ``fired'' pixels, are eliminated from further analysis. To first order, this selection simply cuts off clusters with small diffusion and eliminates clusters with conversion point positions inside sub pixel zones not sensitive to cluster width determination. The fact that compact clusters are not used has no negative effects on analysis results when there are enough clusters with more than 4 ``fired'' pixels in the sample. To investigate in full effects of the cluster selection and to study our analysis efficiency and accuracy for all possible sub pixel cluster positions, an X-ray simulator was developed and measurements were compared with simulations. Data were obtained exposing sensors to a 55Fe source. The total system noise for these exposures was 11e-. The noise power spectrum density is shown in Fig.1. The base line subtraction algorithm performance is illustrated in Fig.2. There are 6097 Ka,b clusters recorded in the sample and 97% of them are clusters with 4 or more ``fired'' pixels (see Fig.3). X-ray clusters with the total amplitude in the range of Ka,b peaks were fit to a model function using MINUIT minimization package. The model function is a 2D Gaussian integrated over the pixel area. The fit range usually is a 3x3 zone around the pixel with maximum amplitude. In our case, this zone contains most of the cluster charge and is small enough to keep cluster pile up negligible. The pixel amplitude error has contributions from both the system noise and signal fluctuations. Errors are calculated for each pixel, taking both contributions into account. The fit was successful for 94.5% of the clusters. Thus the method total efficiency is 92% for our data sample. The distributions of fitted parameters are shown in Fig.4. Measured diffusion sigma values are shown in Fig.5. They peak at 3.6 micron. Simulation:These measurements have been compared with simulations. Sets of 6000 K_a,b clusters with fixed sigma value and randomly distributed x- and y-coordinates have been generated. Distributions of simulated values are shown in Fig.6. Simulated clusters have been embedded into zero exposure images and processed through the same analysis pipeline as real 55Fe frames, see Fig.7. The outcome for a set with sigma=3.55 micron is shown on Fig.5 in blue. The 95% of these clusters were fit successfully. The reconstructed sigma values for this set peak at 3.6 micron and r.m.s. of the distribution is 0.31 micron. Fitted parameters are shown in Fig.8. Conclusion:Measurements and simulation are in good agreement for the ``window'' peak. The characteristic diffusion value for these measurements is estimated as sigma = 3.55 micron. The statistical accuracy is estimated using the r.m.s. of the blue histogram as ~0.01micron. More extensive simulations are planned for systematic uncertainties study. Fig.3 X-ray amplitude and cluster size distributions for (left to right): all clusters; one pixel clusters; two pixel clusters; three pixel clusters; four pixel clusters; five or more pixel clusters; cluster size. Raw data have been processed using sparse signal base line subtraction algorithm. Fig.4 Fitted parameters: total amplitude; x-, y- coordinates and chi2 of the fits. Fig.6 Simulated: total amplitude; maximum amplitude and local x-, y- coordinates. Fig.5.The distribution of sigma values measured with a prototype device is shown in green. The simulated X-rays with diffusion sigma value fixed at 3.55 micron is shown in blue. Pixel size is 10micron. Fig.2 Results of application the base line subtraction algorithm to this data set. Fig.7 Simulated clusters processed through the analysis pipeline. X-ray amplitude and cluster size distributions for (left to right): all clusters; one pixel clusters (histogram is empty); two pixel clusters; three pixel clusters; four pixel clusters; five or more pixel clusters; cluster size. Fig.1 Noise power spectral density Fig.8 Fitted parameters for simulated clusters: total amplitude; x-, y- coordinates and chi2 of the fits.