Download
1 / 6
60 likes | 278 Views
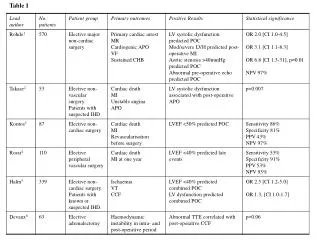
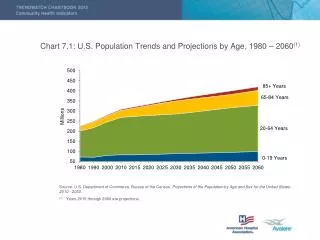
Table 7.1: U.S. Population Trends and Projections (1) by Age, 1980 – 2060. Source: U.S. Department of Commerce, Bureau of the Census. Projections of the Population by Age and Sex for the United States: 2010-2060 . Years 2015 through 2060 are projections. Data for Chart 7.1. A-50.

E N D
Table 7.1: U.S. Population Trends and Projections(1) by Age, 1980 – 2060 • Source: U.S. Department of Commerce, Bureau of the Census. Projections of the Population by Age and Sex for the United States: 2010-2060. • Years 2015 through 2060 are projections. • Data for Chart 7.1 A-50
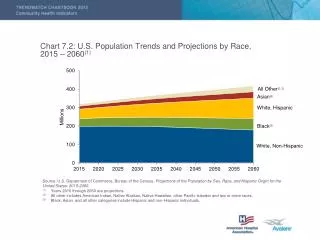
Table 7.2: U.S. Population Trends and Projections(1) by Race,(2) 2015 – 2060 • Source: U.S. Department of Commerce, Bureau of the Census. Projections of the Population by Sex, Race, and Hispanic Origin for the United States: 2015-2060 • Years 2015 through 2060 are projections. • Black, Asian, and All Other categories include individuals of Hispanic and non-Hispanic origin. • All Other includes American Indian, Native Alaskan, Native Hawaiian, other Pacific Islander and two or more races. • Data for Chart 7.2 A-51
Table 7.3: Age-adjusted Death Rates, Selected Causes, by Race, 2010 Source: National Center for Health Statistics. (2013). Health, United States, 2011. Hyattsville, MD. (1) Racial categories include individuals of both Hispanic and non-Hispanic origin. Data for Chart 7.3 Table 7.4: Number of Persons with Asthma, 1980 – 2011 Source: Centers for Disease Control and Prevention (2002). “Asthma Surveillance – United States, 1980-1999.” National Center for Health Statistics. National Health Interview Survey 2001, 2005, 2006, 2007, 2008, 2009, 2010, and 2011. Data for Chart 7.6 A-52
Table 7.5: Percent of Adults Who Are Overweight(1) and Obese, 1960 – 2010 Source: National Center for Health Statistics. (2013). Health, United States, 2012. Hyattsville, MD. (1) Data are adjusted to 2000 standard population. (2) Overweight includes obese. Data for Chart 7.8 Table 7.6: Percent Uninsured by Race,(1)(2) 1984 – 2011 Source: National Center for Health Statistics. (2013). Health, United States, 2011. Hyattsville, MD. (1) White and Black categories include individuals of non-Hispanic origin only. Asian category includes individuals of Hispanic and non-Hispanic origin. (2) Data for population under age 65. Data for Chart 7.13 A-53
Table 7.7: Percent of Persons with No Usual Source of Care by Race,(1) 1993 – 2011 Source: National Center for Health Statistics. (2013). Health, United States, 2011. Hyattsville, MD. (1) White and Black categories include individuals of non-Hispanic origin only. Asian category includes individuals of Hispanic and non-Hispanic origin. Data for Charts 7.14, 7.16 A-54