Download
1 / 17
170 likes | 346 Views
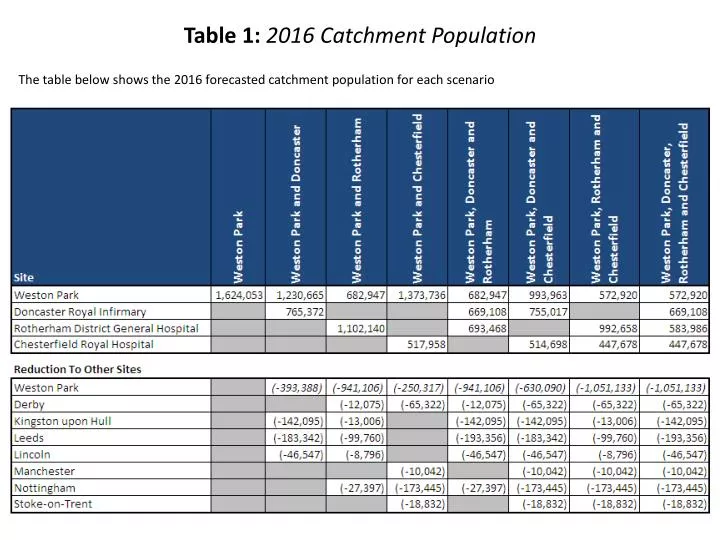
Table 1: 2016 Catchment Population. The table below shows the 2016 forecasted catchment population for each scenario. Table 2: Fractions by Radiotherapy Centre and Number of Linear Accelerators.

E N D
Table 1: 2016 Catchment Population The table below shows the 2016 forecasted catchment population for each scenario
Table 2: Fractions by Radiotherapy Centre and Number of Linear Accelerators The table above shows the number of fractions, based on the NRAG planning assumption of 43,017 fractions per million population. The table also identifies the implied number of linear accelerators (in brackets) required based on 8,300 fractions per linear accelerator per year.
Results assuming no inter-network flows (ie NTCN “self contained”), including 45 min drive-time isochrones…
Table 1: 2016 NTCN Resident Catchment Population The table below shows the 2016 forecasted catchment population for each scenario
Table 2: Fractions by Radiotherapy Centre and Number of Linear Accelerators The table above shows the number of fractions, based on the NRAG planning assumption of 43,017 fractions per million population. The table also identifies the implied number of linear accelerators (in brackets) required based on 8,300 fractions per linear accelerator per year.