Download
1 / 15
150 likes | 172 Views
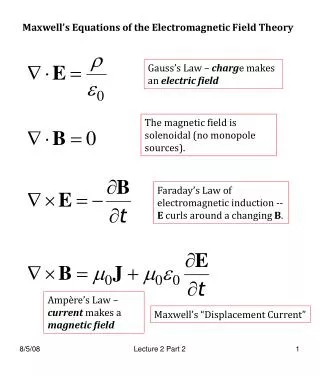
Fluctuation Properties of Electromagnetic Field. Max Zolotorev. CBP AFRD LBNL. Examples of radiated field. E. Electric field of spontaneous radiation of a single atom or electric field excited by single electron passing through resonator cavity or response of an oscillator to a kick and….

E N D
Fluctuation Properties of Electromagnetic Field Max Zolotorev CBP AFRD LBNL
Examples of radiated field E Electric field of spontaneous radiation of a single atom or electric field excited by single electron passing through resonator cavity or response of an oscillator to a kick and… t E Electric field of spontaneous radiation of a single electron passing through a wiggler t
Chaotic Electromagnetic Field Excitation time of atoms or electrons’ time of entrance into wiggler t E E Cos[t] t I E Sin[t] t
Coherent Electromagnetic Field E Cos[t] E E Sin[t] t Media with inverse population (atomic or electron beam in wiggler) can amplify signal (and + positive feedback = generator)
Max, you are telling lies ! If you are right, why do we not observe 100% fluctuations in the signal from fluorescent lamp on time scale 10-20 ns (life time of transitions)? Photo detector and oscilloscope have right time resolution. Light radiated from area >> d2 (d ~ transverse coherence size ~/ , - wave length and - observation angle) is incoherent, thus intensities add and therefore observer will see very small fluctuations. We can observe 100% fluctuations, but we need to install diaphragms that will transmit light only from area of coherence. I When we try to observe 100% fluctuations, we are force to go to small solid angle and thus small intensity and gives rise to the question When do quantum phenomena become important ? t
1 ≈ 10-2 Exp[h/kT]-1 Fields can be treated classically if degeneracy parameter >>1 Degeneracy parameter Transverse coherence sized ~ / Longitudinal coherence size l ~ c / Volume of coherence d2 l Degeneracy parameter = number of photons in volume of coherence = number of photons per mode Sunlight = 1. Thermal source 2. Synchrotron radiation ≈ N / (c F) ≈ 104/F F = number of transverse coherence modes in beam area ≈ 2 MW N / (c F) for KW > 1 3. Wiggler radiation 4. Laser ~1 mJ visible light ≈ 1015
Can information about longitudinal charge distribution be extracted from incoherent radiation ? In time domain Time domain picture of incoherent radiation produced by Gaussian longitudinal charge distribution and filtered with =10 and ≈10/ Pulse-to-pulse fluctuations in intensity under these conditions will be ~ 1/√M, where M is the number of groups. In this case M ≈10 and fluctuations ~ 30%. This does not depend on the number of electrons if the degeneracy parameter is large. Pulse length can be recovered from known filter bandwidth and measured fluctuations
Frequency Domain Spectral fluctuations: narrow spikes with width 1/b.
Probability distribution for spikes for beam size smaller than transverse coherence size and/or resolution of spectrometer < 1/b, follows the Poisson distribution for beam size larger than transverse coherence size and/or resolution of spectrometer >1/b, follows the Gamma distribution Experimental data taken at Brookhaven National Lab (P. Catravs)
Surviving in case of poor resolution Average spike width gives information about time duration of radiation when resolution of spectrometer is much better than inverse length of radiation pulse. In the opposite case, it is still possible to extract information about time duration of radiation. Signal obtained in the frequency band equal to resolution of the spectrometer will be the sum of several independent events (spikes in frequency domain and from different transverse coherence regions) each distributed according Poisson statistic. Resulting distribution will follow Gamma distribution. Measured distribution of spectral intensity fluctuations for 1.5 ps and 4.5 ps bunch lengths are plotted along with gamma distribution fit. where x = I/<I> , and k is number of independent unresolved spikes The same information can be extracted from the measurement of fluctuationsrelative to the base. For example if k =10, it will be 30% of relative fluctuations and, otherwise, if 30% fluctuations are measured then there were 10 independent spikes in spectrometer resolution width. One can find the number of spikes in frequency domain and time duration of radiation by using spatial transverse mode filter.
Can it be used at LCLS for measurement of X ray pulse duration? degeneracy parameter ≈ 2 Mg N / (c F) and F~ area of the beam / 2 for fixed linear density and size of the electron beam ~ 3 but if beam emittance~/4; F~1 and ~ for LCLS (Mg~200 ) ≈ .15 nm; ≈ gain x104 are good enough even for gain ≈ 1. Fluctuation signal can be used for tuning LCLS. One can measure in time domain, then number of spikes ~ 103 - 104 and fluctuations are ~ 1 - 3% (this can be used for rough estimation of x-ray pulse length) Or, for a one-shot measurement, can use x ray spectrometer with width / ~ 10-3 and resolution / ~ 10-6 spectrometer resolution X ray frequency It looks possible !