Download
1 / 75
750 likes | 887 Views
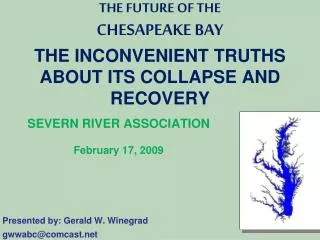
THE FUTURE OF THE CHESAPEAKE BAY THE INCONVENIENT TRUTHS ABOUT ITS COLLAPSE AND RECOVERY. SEVERN RIVER ASSOCIATION February 17, 2009 Presented by: Gerald W. Winegrad gwwabc@comcast.net. THE BAY HAS MORE THAN 3,000 SPECIES OF WILDLIFE. HOODED MERGANSER.

E N D
THE FUTURE OF THE CHESAPEAKE BAYTHE INCONVENIENT TRUTHS ABOUT ITS COLLAPSE AND RECOVERY SEVERN RIVER ASSOCIATION February 17, 2009 Presented by: Gerald W. Winegrad gwwabc@comcast.net
THE BAY HAS MORE THAN 3,000SPECIES OF WILDLIFE HOODED MERGANSER More than one million waterfowl (ducks, geese, swans ) visit the Bay annually, 29 species in all
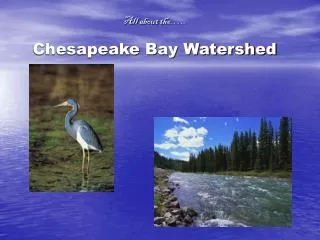
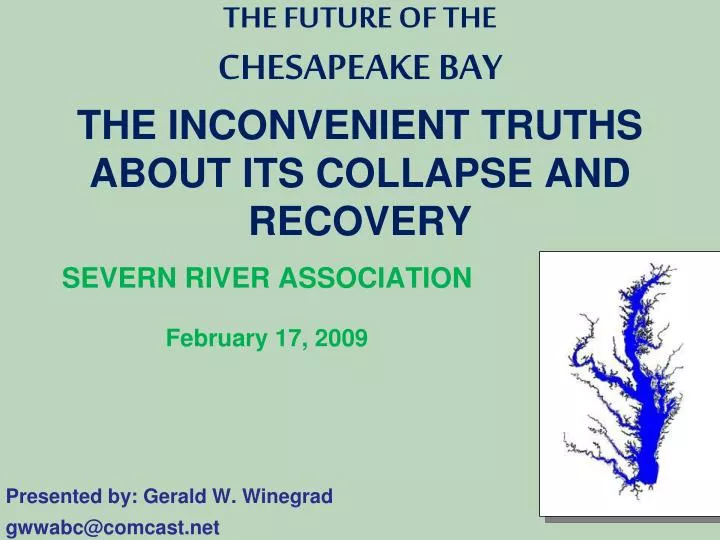
Chesapeake Bay Watershed New York Pennsylvania Maryland Delaware West Virginia District of Columbia Virginia
THE SCENIC SEVERN WATER QUALITY IMPAIRED: DECLINE DUE TO URBAN RUNOFF (DEVELOPMENT), WASTEWATER TREATMENT PLANTS, AGRICULTURAL RUNOFF, AND SEPTIC TANKS. WILL WE RESTORE THE SEVERN’S 81 SQ. MI. WATERSHED AND ITS 140 MILES OF STREAMS?
WHAT’S THE STATUS OF THE CHESAPEAKE BAY? According to the most recent reports and data, the Chesapeake is in dismal shape. Bay Grass Plantings are used to help attain goal of 185,000 acres, but due to poor water quality, 90% of grasses planted may die *April 2008 EPA Bay Program Ecosystem Health Report documents failure to meet most goals, calling Bay degraded, and acknowledging that key 2010 goals will not be met. *April 2008 scientists score the Bay a C- in their Chesapeake Bay Report Card, far below what is needed for a healthy Bay. Data gathered from more than 150 monitoring sites throughout the Bay document that the health of the Bay remains poor--not on the road to recovery. *Chesapeake Bay Foundation 2007 Bay Report Card rated the Bay a D, a 28 out of 100. CBF says the Bay is “in critical condition” & calls for end to politics of postponement.
**Key water quality measurements have shown little progress over 1985 levels.**Nitrogen and phosphorus levels in the Bay show no real long-term trends.**Water clarity and concentrations of chlorophyll a (algae measurements) have worsened.**Bottom habitats and phytoplankton communities show no clear trends EPA BAY PROGRAM APRIL 2007 REPORT ON BAY PAINTS A BLEAK PICTURE:
Over 90% of the Bay and its tidal rivers are impaired* due to low dissolved oxygen levels and poor water clarity, all related to nutrient and sediment pollution. The Bay is imperiled. The states will be subject to suit if waters do not meet CWA requirements by 2010. Impaired Water *Impaired means designated by the EPA as not meeting Clean Water Act standards due to pollutants under Sec. 303(d).
AMERICA’S PREMIER WATERSHED RESTORATION PARTNERSHIP IS FAILING! ACCOUNTABILITY AND RESPONSIBILITY LACKING
Why has the Bay declined so badly?Excess nutrients and sediment. They are the focus of Bay restoration. Toxic chemicals also present threats.
Sources of Nitrogen Loads to the Chesapeake Bay 2005 266 million lbs. TN/yr
Sources of Phosphorus Loads to the Chesapeake Bay 2005 18.5 million lbs. TP/yr
Sources of Sediment Loads to the Chesapeake Bay 2005 4.87 million tons/yr
Pollution Control Summary EPA BAY PROGRAM: LESS THAN HALF OF THE POLLUTION REDUCTION EFFORTS NEEDED TO ACHIEVE THE NUTRIENT GOALS HAVE BEEN UNDERTAKEN SINCE 1985. EPA BAY PROGRAM: THE BAY IS SEVERELY DEGRADED & AT CURRENT RATE OF REDUCTION IT WOULD BE 2034 BEFORE NITROGEN REDUCTIONS AGREED UPON ARE MET AND 2050 FOR THE PHOSPHORUS GOAL.
58% of Goal Achieved Maryland Nitrogen Loads to the Chesapeake Bay 2010
77% of Goal Achieved Maryland Phosphorus Loads to the Chesapeake Bay 2010
48% of Goal Achieved Maryland Sediment Loads to the Chesapeake Bay 2010
SOUTH RIVER CATFISH HAVE CANCER THE CAPITAL January 26, 2006 Front Page, by Pamela Wood“Nearly two-thirds of catfish pulled from the South River last spring had cancerous tumors.” 21 areas of the Bay have fishing bans or fish consumption advisories because of contaminants. This brown bullhead catfish from the South River near Annapolis is one of 30 tested, 19 of which had cancerous growths.
BROWN TIDE KILLS 7,000 INNER HARBOR FISH WBAL-TV June 5, 2007 BALTIMORE -- State environmental officials said a lack of oxygen killed thousands of fish in Baltimore's Inner Harbor last weekend. State program director Charles Poukish said the fish kill is the result of an algae bloom or brown tide. HUNDREDS OF THOUSANDS OF FISH KILLED IN POTOMAC Aug. 21, 2007 Virginia DEQ. Most of the algae in the Potomac River bloom were Karlodinium. This type of algae turns the water a reddish-brown color and produces a toxin that can kill fish. The fish also die due to a lack of oxygen in the water that is caused by the bloom. MARYLAND HAD 120+ SEPARATE FISH KILLS IN 2007 BAY HAD 5TH WORST DEAD ZONE ON RECORD IN 2007
'Intersex' Fish Spark Pollution Debate (AP) WASHINGTON, SEPT. 6, 2006. U.S. scientists say abnormal "intersex" fish, with both male and female characteristics, have been discovered in the Potomac River and its tributaries across the U.S. capital region, raising questions about how contaminants are affecting millions of people who drink tap water there…. Last month's testing at three tributaries emptying into the Potomac revealed that more than 80 percent of all male smallmouth bass found were growing eggs, according to Vicki S. Blazer, a fish pathologist with the U.S. Geological Survey. Pollution Rising In Tributaries of Bay, Data Show By David A. Fahrenthold, Washington Post Staff Writer, Wednesday, December 5, 2007; B01 The massive government effort to clean up the Chesapeake Bay is not just falling short of its goals. Now the bay's pollution might actually be taking a turn for the worse. New federal research indicates that pollution has crept up in some of the Chesapeake's biggest tributaries this decade, after a slow decline during the 1980s and 1990s. In the Potomac, the Patuxent and other major rivers, the pollutants on the rise include those blamed for low-oxygen "dead zones.“
HEALTH OF MD. CHOPTANK RIVER IS DECLINING, RESEARCHERS SAYS. GREENWIRE(12/11/2007) The health of the Choptank River in Maryland is declining due to pollution from regional farms and new housing developments…. team of biologists recently ranked the Choptank as the second-most-polluted river in Maryland, behind to the Patapsco, which runs through Baltimore… the river has failed to improve. The amount of nitrogen flowing into the river was twice as high in 2005 as it was in 1985… Much of the Choptank's pollution is coming from nitrogen-rich fertilizer, which runs off farm fields and into the river after rains. [66% of nitrogen to Choptank is from agriculture]. From Rona Kobell article in Baltimore Sun, Dec. 9, 2007.
Trends in Shellfish: Oyster Fishery Collapsed 10X increase in oyster biomass= 25% of Bay’s nitrogen reduction goal. Oyster harvest/population in the Bay have collapsed due to overharvesting, disease, pollution and loss of oyster reef habitat. Restoration efforts w/$$$$millions spent have failed to restore oysters.
A KEY GOAL OF BAY AGREEMENT GOAL IS TO INCREASE OYSTERS 10X BY 2010—WE ARE NOT EVEN CLOSE Oysters are vital to the Bay's health: they filter the water removing nutrients and sediment, improving clarity. Oyster populations have been reduced to ~1-2%% of historic levels. In 1890, oysters could filter all the Bay’s waters in 3-5 days; now it would take a year or more.
Shad Returning to the Susquehanna River: Another Collapsed Fishery Historically, the upper Bay was the most productive area for American shad. From the late 1800s to the mid-1900s, shad was the most economically valuable food fish harvested in MD and VA waters. MD declared the shad “commercially endangered” and shut the fishery in 1980, but despite hatchery rearing and release, only 19,912 shad reached the Conowingo dam in 2007, the lowest level since 1993 reflecting a seven year decline.
How Are Blue Crabs Doing? IN 2008, MARYLAND AND VIRGINIA GOVERNORS PETITION FEDS TO DECLARE CRAB FISHERY A DISASTER; FEDS COMPLY WITH $20 MILLION IN AID. THE REAL DISASTER: THE FAILURE IN LEADERSHIP TO REGULATE HARVEST & RESTORE THE BAY TO PREVENT FISHERY COLLAPSES.
BAY GRASSES In 2007, Bay grasses covered nearly 65,000 acres – or just 35% of the 185,000-acre restoration goal. Bay grasses are essential for crabs with 40X the abundance of juvenile crabs as compared to barren bottom.
ROCKFISH RECOVERY WAS ACHIEVED AFTER SEVERE HARVEST RESTRICTIONS, INCLUDING MORATORIUM IN CHESAPEAKE BAY BUT NOW THERE ARE CONCERNS OVER NUTRITION RELATED TO DEPLETED MENHADEN STOCKS AND DISEASE. 2008 YOUNG-OF-YEAR INDEX SLUMPED TO 3.2, LOWEST LEVEL FOR YOUNG FISH SINCE 1990.
Chesapeake's Rockfish Overrun by Disease; Epidemic Hits Species Hailed for Revival, Then Weakened by Polluted Waters By Elizabeth Williamson, Washington Post Staff Writer, Saturday, March 11, 2006; Page A01 A wasting disease that kills rockfish and can cause a severe skin infection in humans has spread to nearly three-quarters of the rockfish in the Chesapeake Bay, cradle of the mid-Atlantic's most popular game fish. The disease also sends a grim message about the entire bay ecosystem. The rockfish remains bay conservationists' only success story -- a species nearly wiped out, then revived by fishing limits. But as the number of rockfish surged, the fish remained in a body of water too polluted to support the level of life it once did.
MYCOBACTERIOSIS (Chronic Wasting Disease) AFFECTS MORE THAN 50% OF ROCKFISH MYCOBACTERIUM MARINUM EATS FISH TISSUE HUMAN HEALTH ADVISORIES LIMIT THE CONSUMPTION OF ROCKFISH BAYWIDE DUE TO MERCURY CONTAMINATION
A DECADE AFTER PFIESTERIA HYSTERIA, SERIOUS HUMAN ILLNESSES REGULARY OCCUR FROM BAY WATER CONTACT AND HANDLING FISH. Mycobacterium marinum
BERNIE VOITH AT HIS DOCK ON PLUM CREEK OFF THE SEVERN RIVER BERNIE HAS SWAM AND FISHED THE WATERS OF THE BAY FOR 50 YEARS
BERNIE VOITH’S RIGHT LEG FROM BACTERIAL INFECTION CONTRACTED IN JULY 2005 WHEN HE SCRATCHED HIS LEG IN PLUM CREEK OFF THE SEVERN RIVER IN HIS BACKYARD. THE ENTEROBACTER NEARLY COST BERNIE HIS LIFE. BERNIE WILL NEVER GO IN THE WATER AGAIN. • FORMER AA COUNCIL WOMAN BARBARA SAMORAJCZYK SCRAPPED HER LEG IN HER BACKYARD ON LAKE OGLETON AND HAD TWO ABCESSES IN HER LEG REQUIRING MONTHS OF MEDICAL TREATMENT. • STAFF AT ARLINGTON ECHO ENVIRONMENTAL EDUCATION CENTER ON THE SEVERN RIVER HAVE HAD SIMILAR LEG INFECTIONS AND SCHOOL CHILDREN AT THE COUNTY’S MAIN ENV. ED. FACILITY CAN NO LONGER GO IN THE WATER.
Three key water quality measures for a healthy Bay all linked to reducing nutrients and sediment • Water Clarity – light for underwater Bay grasses • Chlorophyll a – fish food, and fewer algae blooms • Dissolved Oxygen – for fish, crabs and oysters Together, these three criteria define the conditions necessary to protect the wide variety of the Bay’s living resources and their habitats and to remove the Bay’s waters from the Clean Water Act EPA impaired waters list.
DISSOLVED OXYGEN IS CRITICAL FOR LIVING RESOURCES BUT DECLINED FROM 37% OF GOAL IN 2006 TO 12% IN 2007.
GOOD WATER CLARITY IS NEEDED FOR BAY GRASSES TO THRIVE (CRAB NURSERIES).
JUST WHEN YOU THOUGHT IT COULD NOT GET ANY WORSE……… IT DOES! ANNE ARUNDEL POPULATION HAS INCREASED BY MORE THAN 4X SINCE 1950 WITH LOSS OF 42,000 FORESTED ACRES 1986-1999, AND 536 ACRES OF WETLANDS (1973-2002) & 125% MORE HOUSING UNITS 1970-PRESENT.
DEVELOPMENT UNDERMINING RESTORATION: EPA INSPECTOR GENERAL REPORT (Sept. 2007) (09/13/2007)E &ENews Rapid development in the Chesapeake Bay watershed is hindering federal and state efforts to stanch the flow of nutrients and sediments into the bay and its tributaries, U.S. EPA's inspector general said in a report today…. As a result, the cleanup effort -- aimed at removing the bay from EPA's list of impaired waters by 2010 -- won't meet its goal until 2028 at earliest, the report says. BASE REALIGNMENT AND CLOSURE ACT (BRAC) **BRAC will generate the single largest job growth in Maryland since the end of World War II—at least 45,000 and as many as 60,000 jobs. **MDP expects 28,176 new MD BRAC households. **Army EIS on BRAC impacts around Ft. Meade projects a population increase of 41,000 with 33 acres of new parking lots just for new office structures. **Growth concentrated in two counties, Harford (APG) and AA (Ft. Meade).
“IF CURRENT DEVELOPMENT TRENDS CONTINUE, AN ADDITIONAL 250,000 ACRES OF WATERSHED LAND WILL BECOME IMPERVIOUS BETWEEN 2000 AND 2010 AND 9.5 MILLION MORE ACRES OF FORESTS WILL BE THREATENED BY DEVELOPMENT BY 2030.” EPA CHESAPEAKE BAY PROGRAM, APRIL 3, 2008 NITROGEN LOADING IS 16X GREATER THAN 1607 AND PHOSPHORUS LOADING 30X GREATER. ONE ACRE PARKING LOT PRODUCES 40X THE RUNOFF OF ONE FORESTED ACRE.
JULY 2008 EPA INSPECTOR GENERAL’S REPORT FAULTS AGENCY'S BAY EFFORTS. Baltimore Sun. July 17, 2008. “Yesterday's report is one of several released in recent years that has been critical of the EPA's Chesapeake Bay cleanup strategy. A Government Accountability Office report released in 2005 criticized the bay program for painting too rosy a picture of cleanup successes.” Investigators with the Environmental Protection Agency's inspector general found and cited several new problems with the bay's cleanup, including uncontrolled land development, the limited implementation of agricultural conservation practices, and the inability to control air emissions that are adversely affecting bay water quality.
AVERAGE EDGE-OF-FIELD NITROGEN FLOWS IFROM CORN IS ESTIMATED AT 30 LBS PER ACRE; HAYFIELD= 6 LBS. SPIKE IN ROW CROP PRODUCTION INCREASES NUTRIENT, SEDIMENT LOADS TO BAY; RECORD PRICES SPURRING FARMERS IN WATERSHED TO WORK IDLE LAND, USE MORE FERTILIZER BAY JOURNAL OCTOBER 2008 An analysis of USDA figures by the Bay Journal indicate that about 65,000 additional acres Baywide were plowed for crops this year than in 2006. The increased crop acreage, coupled with more intensive production from those fields, had the potential to increase runoff from row crops by 8 million to 9 million pounds of nitrogen since 2005, an average of nearly 3 million pounds a year. In comparison, nitrogen reductions from all sources in the watershed have averaged about 3.5 million pounds per year. "The combination of land use change and intensification will start canceling out nutrient reductions.” REASON: ETHANOL + FOOD SHORTAGE.
17 Million People Live in the Bay Watershed w/154,000 more per year 2000-07 • In last Decade, 8% population growth = 41% impervious surface increase • Lost 50% of wetlands and 40% of forests & forests are fragmented • Bay watershed in 1607 was 95% forested, now at 58%, 41% in Maryland • From 1982-1997, 750,000 acres of forest were converted to development • Maryland lost 141,000 acres of forest,1986-1999 (6%)
Chesapeake Bay Watershed PopulationGROWING BY 170,000 MORE PEOPLE PER YEAR Bay Watershed Population (millions) Source: Chesapeake Bay Program Exacerbating the sheer numbers is the sprawl: 39 of Maryland’s157 towns and cities LOST population from 2000-2006, while Maryland population grew by 6%. Human population in the Chesapeake Bay watershed has more than doubled since 1950 from 8.1 million to 16.9 million; in 1900=4 million. Population projected to increase to nearly 20 million by 2030. BRAC = 80,000 more people in Maryland. Native American population in Chesapeake Bay in 1607 = ~30,000, perhaps 100,000 in entire watershed.