Download
1 / 21
210 likes | 341 Views
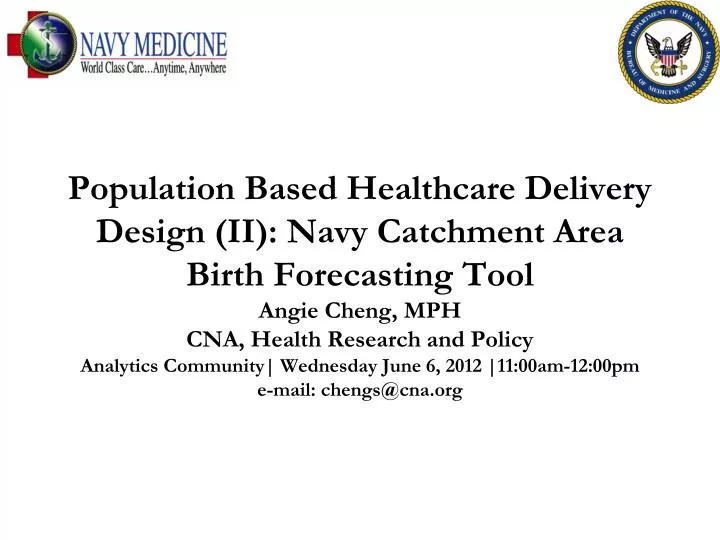
Population Based Healthcare Delivery Design (II): Navy Catchment Area Birth Forecasting Tool Angie Cheng, MPH CNA, Health Research and Policy Analytics Community| Wednesday June 6, 2012 |11:00am-12:00pm e-mail: chengs@cna.org. C, P, O.

E N D
Population Based Healthcare Delivery Design (II): Navy Catchment Area Birth Forecasting ToolAngie Cheng, MPHCNA, Health Research and PolicyAnalytics Community| Wednesday June 6, 2012 |11:00am-12:00pme-mail: chengs@cna.org
C, P, O • 1)Context: Inadequate access to system-level perinatal data may lead to misalignment of resources and demand • 2)Purpose: CNA created a data-driven analytical tool to help optimize perinatal product line efficiency • 3)Outcome: Decision-makers can make more informed perinatal resource decisions using the Navy Catchment Area Birth Forecasting Tool to visualize historical birth volume trends, calculate population-based birth forecasts, and set birth volume targets across MTFs and Navy catchment areas FOR OFFICIAL USE ONLY
Outline • Background • Tasking and purpose • Birth forecast tool contents • Data source and methods • Walk through the MS Excel tool • Case scenarios • Conclusions FOR OFFICIAL USE ONLY
Background • Highest utilization product line is Obstetrics • MTF direct inpatient care for Obstetrics constitutes • 36% of inpatient Navy healthcare costs • 50% of inpatient workload (admissions) FOR OFFICIAL USE ONLY
Background • Problems identified by Navy Perinatal community: • No centralized oversight in practices and resourcing • Misalignment of resources and demand • Specialty leaders have difficulty accessing system level workload data • Need data-driven analytical tools that even the playing field and optimize perinatal product line efficiency FOR OFFICIAL USE ONLY
Tasking and purpose • BUMED M81 and the Perinatal Advisory Board tasked CNA to develop a tool that: • Provides historic trends in birth volume • Forecasts annual birth volume based on user entered population changes • Helps users visualize seasonality of birth volume and set monthly birth volume targets • Tool was presented to the PAB in August 2011 and disseminated to Obstetrics leaders across Navy MTFs • Updated with FY2011 data in May 2012 (version 2.3) FOR OFFICIAL USE ONLY
Birth forecasting tool contents • Annual Direct Care/Purchased Care Catchment Area Birth Volume Forecast Module • Catchment Area Female Beneficiary Population Fertility Module • Troop Movement Catchment Area Birth Volume Forecast Module • Monthly Catchment Area Birth Volume Target Module • Monthly Military Treatment Facility Birth Volume Target Module • Annual Military Treatment Facility Birth Volume Module • Accompanying worksheets and underlying data in the Excel document FOR OFFICIAL USE ONLY
Data sources • MHS Data Repository • Inpatient Admissions • Standard Inpatient Data Record (SIDR) FY 2005-2011 • Purchased Care Institutional (PCI) FY 2005-2011 • Population • M2 DEERS FY 2005-2011 • Births are defined using Diagnosis Related Groups (DRGs) • DRGs 370-375 (prior to 2007) • MS-DRGs 765-768, 774,775 • Births of multiples are counted as one delivery FOR OFFICIAL USE ONLY
Population concepts • Catchment Areas| Multi-Service Market Areas (MSMAs) | MTFs • National Capital Area (NCA) MSMA • NNMC Bethesda (Walter Reed NMMC) • 779th Med Grp-Andrews • Dewitt ACH- Ft. Belvoir • Walter Reed AMC • Tidewater MSMA • NMC Portsmouth • 633rd Med Grp- JB Langley-Eustis • McDonald AHC- Ft. Eustis • San Diego MSMA • NMC San Diego • NH Camp Pendleton • Puget Sound MSMA • NH Bremerton • NH Oak Harbor • Madigan AMC- Ft. Lewis • CONUS Catchment Areas • NH Beaufort • NH Camp Lejeune • NH Jacksonville • NH Pensacola • NH Lemoore • NH Twentynine Palms • OCONUS Catchment Areas • NH Guam-Agana • NH Guantanamo • NH Naples • NH Okinawa • NH Rota • NH Sigonella • NH Yokosuka FOR OFFICIAL USE ONLY
Birth forecasting method • General Fertility Rate= # Births # Female population (15-45) • Birth Forecast=Forecasted Female Population x Fertility Rate • Annual DC/PC Catchment Area Module uses FY2011 catchment area-specific fertility rates as baseline • Forecast error bounds incorporate variation of rates over time • Female population changes based on projected changes in active military end strength1 using catchment area specific gender and martial status statistics • Troop Movement Module uses specific beneficiary category and rank population and fertility rates to forecast births • FY2013 Defense Budget: http://comptroller.defense.gov/budget.html FOR OFFICIAL USE ONLY
Annual direct care and purchased care births from FY 2005-2011 and forecasts for FY 2012-2014 Click on cell for a drop down arrow to select catchment Forecast Results Select whether you want to use the baseline for % direct care, population change and fertility rate. If not, select “No” and enter data in blue cells FOR OFFICIAL USE ONLY
Birth volume, population counts, and fertility rates for AD females, AD family, and other Click on cell for a drop down arrow to select catchment area/ MSMA Forecast results for 2012-2014 based on population change rate from DoD end strength projections FY2011fertility rate used to forecast FOR OFFICIAL USE ONLY
Birth volume and female population data forecasts based on AD enlisted and officer movement Forecast Results Select whether you want to use the baseline for % Female and % Married by Rank. If not, select “No” and enter data in blue cells Enter expected increase or decrease in AD enlisted and officer populations (male and female combined) for the catchment area/MSMA FOR OFFICIAL USE ONLY
Graph of monthly catchment area birth volume from FY 2005-2011 Enter a target monthly birth volume based on an estimate from the graph where the historical seasonal variation is lowest Red Target volume line adjusts based on what user enters Gray dashed line is set automatically at the minimum volume October 2004-September 2011 FOR OFFICIAL USE ONLY
Graph of monthly MTF birth volume from FY 2005-2011 Enter a target monthly birth volume based on an estimate from the graph where the historical seasonal variation is lowest Gray dashed line is set automatically at the minimum volume Red Target volume line adjusts based on what user enters October 2004-September 2011 FOR OFFICIAL USE ONLY
Graph of annual MTF birth volume from 2005-2011 FOR OFFICIAL USE ONLY
Case scenarios • DoD reduction of end strength by 2017 • 202,100 to 182,100 Marines and 570,000 to 490,000 Army soldiers1 • What impact will a decline of 100,000 troops have on birth volume across the system? • Decline of 6,083 births (~18%) across the system • Marine Corps relocation from Okinawa to Guam by 2014 • 9,000 Marines are moving out of Okinawa, where 4,700 Marines are moving to Guam and about 4,300 will be rotated through Australia, the Philippines and Hawaii2 • What impact will this relocation have on NH Okinawa and NH Guam on perinatal workload? • Okinawa will lose 591 births (~50%), and Guam will gain 260 births (~62%) 1. FY2013 Defense Budget: http://comptroller.defense.gov/budget.html 2. http://www.military.com/news/article/us-to-remove-9000-marines-from-okinawa.html FOR OFFICIAL USE ONLY
DoD reduction of end strength 20,000 broken down using 1:8.5 ratio and 80,000 using 1:5 ratio FOR OFFICIAL USE ONLY
Marine Corps relocation from Okinawa 9,000 broken down using 1:8.5 ratio Use Marine Corp specific marital status and gender statistics FOR OFFICIAL USE ONLY
Marine Corps relocation to Guam 4,700 broken down using 1:8.5 ratio Use Marine Corp specific marital status and gender statistics FOR OFFICIAL USE ONLY
Conclusions • Simple and easy to use tool allows decision makers to make more informed perinatal resource decisions based on data trends and user knowledge • Potential next steps include capturing and integrating staffing requirements into the tool and creating similar analytic tools for other product lines • Most recent version of tool available on the BUMED SharePoint site: https://bumedportal.med.navy.mil/bumed/m8/m81/BirthForecast/default.aspx FOR OFFICIAL USE ONLY