Download
1 / 30
310 likes | 429 Views
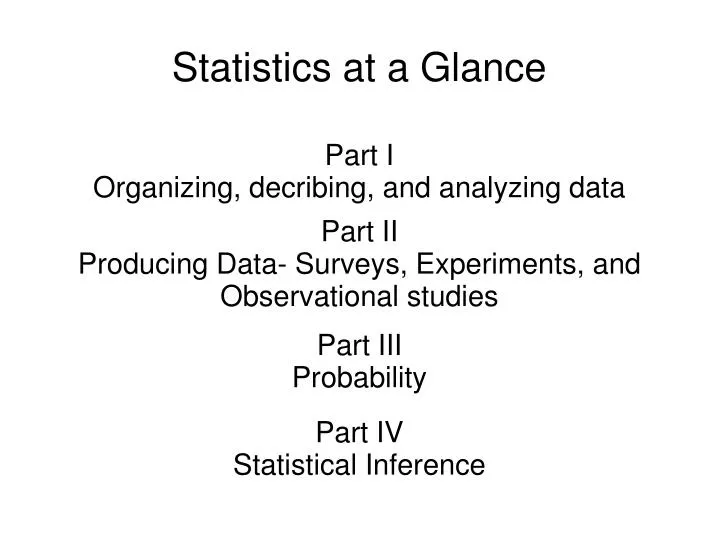
Part I Organizing, decribing, and analyzing data. Statistics at a Glance. Part II Producing Data- Surveys, Experiments, and Observational studies. Part III Probability. Part IV Statistical Inference. Attendance Policy and Dances?. Data or Personal Experience?. Airplane Crash Deaths?.

E N D
Part I Organizing, decribing, and analyzing data Statistics at a Glance Part II Producing Data- Surveys, Experiments, and Observational studies Part III Probability Part IV Statistical Inference
Attendance Policy and Dances? Data or Personal Experience? Airplane Crash Deaths? Leukemia and Power Lines?
Available Data Data that were produced in the past for some other purpose but that may help answer a present question. Where does data come from? • Producing Data • Surveys • Experiments • Observational Studies Why might you use either method?
Data Analysis: organizing, displaying, summarizing, and asking questions of data Part IData Analysis
Individuals are the objects described by a set of data. Individuals may be people, but they may also be animals or things. A variable is any characteristic of an individual. A variable can take different values for different individuals. Individuals and Variables
A Categorical Variable places an individual into one of several groups or categories. Categorical and Quantitative Variables A Quantitative Variable takes numerical values for which arithmetic operations such as adding and averaging make sense.
Who are the individuals described by the data? Meeting a new data set... What are the variables? Units? Why were the data gathered? When, where, how, and by whom were the data produced?
Education in the United States Who? Why? What? When, where, how, and by whom?
The distribution of a variable tells us that values the variable takes and how often it takes these values Distribution Birth month in the school? Favorite type of music? Values close together or spread out?
Using statistical tools and ideas to help you examine data in order to describe their main features. Exploratory Data Analysis
Soccer goals scored by the US women's soccer team in 34 games during the 2004 season. 3 0 2 7 8 2 4 3 5 1 1 4 5 3 1 1 3 3 3 2 1 2 2 2 4 3 5 6 1 5 5 1 5 Describing Quantitative Variables What do the numbers tell us?
State vs national ACT scores Relationships between Variables Attendance at different schools within the district Seat belt usage and area of the country
Relationships between Variables Which airline appears to have less delayed flights?
Many relationships between two variables are influenced by other variables lurking in the background (We'll see more examples like this later). Relationships between Variables
Surveys Select a sample Ask questions Draw Conclusions Where the data come from is important! (Ann Lander's) Part IIProducing Data
Observational study slide Are surveys an observational study or experiment?
What are the advantages of one or the other? Why one or the other? Estrogen and Heart Attacks Example
If I flip a coin four times, am I guaranteed to get heads twice? Part IIIProbability The big idea of probability: Chance behavior is unpredictable in the short run but has a predictable pattern in the long run.
This graph shows the probability for each possible number of correct guesses for an experiment in Mr. Bullard's class. If it the results of the experiment where complete chance, how likely would it be that 13 people would guess the correct answer in the experiment? Probability:answers the question “how likely”
Drawing conclusions from data Part IVStatistical Inference
A Gallup survey conducted an Internet survey of 1200 students, aged 13 to 17. They asked, “Have you, yourself, ever cheated on a test or exam?” Forty-eight percent said “yes.” Statistical Inference If Gallup had asked the same question of all 13-to-17 year old students, would exactly 48% have said yes?
A Gallup survey conducted an Internet survey of 1200 students, aged 13 to 17. They asked, “Have you, yourself, ever cheated on a test or exam?” Forty-eight percent said “yes.” Statistical Inference If they had selected a different sample of 1200 students to respond to the survey, would they have gotten the same percent?
Even under the best of situations, variation is everywhere. When we study statistical inference, we learn that even with variation, we can be quite confident that between 45% and 51% of all teenage students would say that they have cheated on a test. Statistical Inference