Download
1 / 17
170 likes | 283 Views
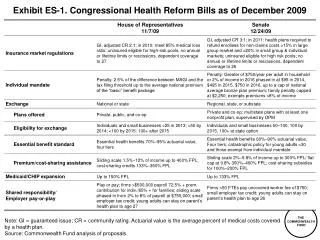
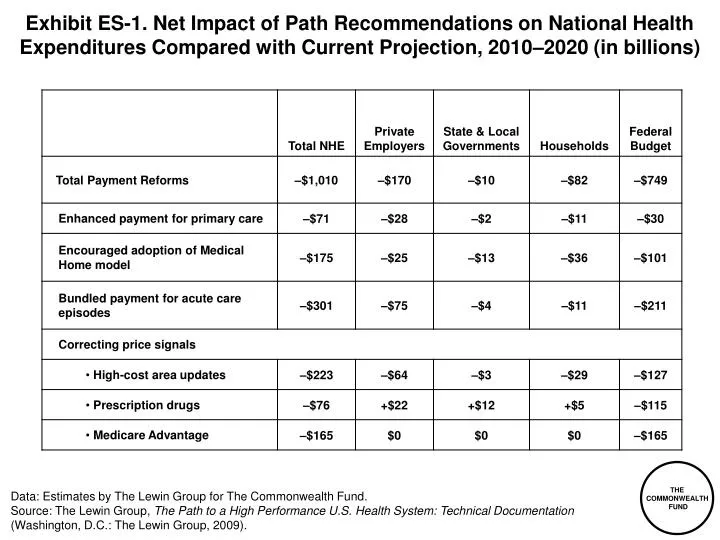
Exhibit ES-1 . Net Impact of Path Recommendations on National Health Expenditures Compared with Current Projection, 2010–2020 (in billions). Data: Estimates by The Lewin Group for The Commonwealth Fund.

E N D
Exhibit ES-1. Net Impact of Path Recommendations on National Health Expenditures Compared with Current Projection, 2010–2020 (in billions) Data: Estimates by The Lewin Group for The Commonwealth Fund. Source: The Lewin Group, The Path to a High Performance U.S. Health System: Technical Documentation(Washington, D.C.: The Lewin Group, 2009).
Exhibit ES-2. Total National Health Expenditure Growth for Hospitals and Physicians, Current Projections and with Policy Changes, 2009–2020 Hospital Expenditures (trillions) Physician Expenditures (trillions) $1.6 $1.4 $1.3 $1.1 $0.8 $0.7 Data: Estimates by The Lewin Group for The Commonwealth Fund. Source: The Lewin Group, The Path to a High Performance U.S. Health System: Technical Documentation (Washington, D.C.: The Lewin Group, 2009).
Exhibit 1. Interrelation of Organization and Payment Integrated system capitation Global DRG fee: hospital, post- acute, and physician inpatient Global DRG fee: hospital only Global ambulatory care fees Global primary care fees Blended FFS and medical home fees FFS and DRGs Outcome measures; large % of total payment Less Feasible Care coordination and intermediate outcome measures; moderate % of total payment Continuum of P4P Design Continuum of Payment Bundling More Feasible Preventive care; management of chronic conditions measures; small % of total payment Small MD practice; unrelated hospitals Primary care MD group practice Multi-specialty MD group practice Hospital system Integrated delivery system Source: A. Shih, K. Davis, S. Schoenbaum, A. Gauthier, R. Nuzum, and D. McCarthy, Organizing the U.S. Health Care Delivery System for High Performance (New York: The Commonwealth Fund, Aug. 2008).
Exhibit 2. If Insurer Premium Trend Continues, Public Health Insurance Plan Enrollment Will Grow: Distribution of Coverage by Primary Source Under Current Law (2010) and Path Framework (Small Firms in 2010, All Firms in 2014) Path Framework, Small Firms (2010) Path Framework, All Firms (2014) Current Law (2010) Uninsured 4m 1% Uninsured 4m 1% Medicaid 49m 16% Medicaid 49m 16% Uninsured 49m 16% Private 109m 35% Medicaid 42m 14% Medicare 41m 13% Medicare 41m 13% Private 170m 55% Private 178m 58% Medicare 39m 13% Public Health Insurance Plan 43m 14% Public Health Insurance Plan 105m 34% Source: The Lewin Group, The Path to a High Performance U.S. Health System: Technical Documentation (Washington, D.C.: The Lewin Group, 2009).
Exhibit 3. Adults with an Accessible Primary Care Provider Percent of adults ages 19–64 with an accessible primary care provider* U.S. Average U.S. Variation 2005 * An accessible primary care provider is defined as a usual source of care who provides preventive care, care for new and ongoing health problems, and referrals, and who is easy to get to. Data: B. Mahato, Columbia University analysis of Medical Expenditure Panel Survey. Source: Commonwealth Fund National Scorecard on U.S. Health System Performance, 2008.
Exhibit 4. Receipt of Recommended Screening and Preventive Care for Adults Percent of adults (ages 18+) who received all recommended screening and preventive care within a specific time frame given their age and sex* U.S. Average U.S. Variation 2005 * Recommended care includes seven key screening and preventive services: blood pressure, cholesterol, Pap, mammogram, fecal occult blood test or sigmoidoscopy/colonoscopy, and flu shot. Data: B. Mahato, Columbia University analysis of Medical Expenditure Panel Survey. Source: Commonwealth Fund National Scorecard on U.S. Health System Performance, 2008.
Exhibit 5. Chronic Disease Under Control: Diabetes and Hypertension National Average By Insurance, 1999–2004 Percent Percent * Refers to diabetic adults whose HbA1c is <9.0.** Refers to hypertensive adults whose blood pressure is <140/90 mmHg. Data: J. McWilliams, Harvard University analysis of National Health and Nutrition Examination Survey. Source: Commonwealth Fund National Scorecard on U.S. Health System Performance, 2008.
Exhibit 6. Costs of Care for Medicare Beneficiaries with Multiple Chronic Conditions, by Hospital Referral Regions, 2001 and 2005 CHF = Congestive heart failure; COPD = Chronic obstructive pulmonary disease. Data: G. Anderson and R. Herbert, Johns Hopkins University analysis of Medicare Standard Analytical Files (SAF) 5% Inpatient Data. Source: Commonwealth Fund National Scorecard on U.S. Health System Performance, 2008.
Exhibit 7. Medicare Reimbursement and 30-Day Readmissions by State Source: Commonwealth Fund National Scorecard on U.S. Health System Performance, 2008.
Exhibit 8. Medicare Hospital 30-Day Readmission Rates Percent of Medicare beneficiaries admitted for one of 31 select conditions who are readmitted within 30 days following discharge* U.S. Mean Hospital Percentiles, 2005 State Percentiles, 2005 * See report Appendix B for list of conditions used in the analysis. Data: G. Anderson and R. Herbert, Johns Hopkins University analysis of Medicare Standard Analytical Files (SAF) 5% Inpatient Data. Source: Commonwealth Fund National Scorecard on U.S. Health System Performance, 2008.
Exhibit 9. Average Risk-Adjusted Standardized Spendingfor Hospital Readmissions and Post-Acute CareAfter Coronary Artery Bypass, 2001–2003 Source: G. Hackbarth, R. Reischauer, and A. Mutti, “Collective Accountability for Medical Care—Toward Bundled Medicare Payments,” New England Journal of Medicine, July 3, 2008 359(1):3–5.
Exhibit 10. Net Impact of Path Recommendations on National Health Expenditures Compared with Current Projection, 2010–2020 (in billions) Data: Estimates by The Lewin Group for The Commonwealth Fund. Source: The Lewin Group, The Path to a High Performance U.S. Health System: Technical Documentation(Washington, D.C.: The Lewin Group, 2009).
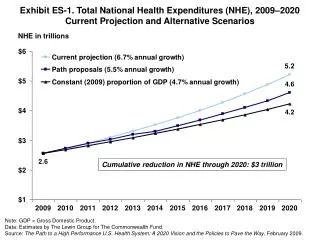
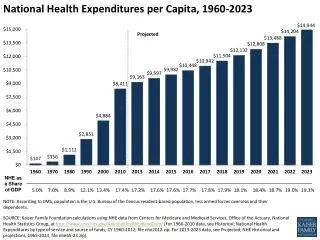
Exhibit 11. Total National Health Expenditures (NHE), 2009–2020Current Projection and Alternative Scenarios NHE in trillions 6.7% annual growth $5.2 $4.6 $4.2 4.7% annual growth 5.5% annual growth $2.6 Cumulative reduction in NHE through 2020: $3 trillion Note: GDP = Gross Domestic Product. Data: Estimates by The Lewin Group for The Commonwealth Fund. Source: The Commonwealth Fund Commission on a High Performance Health System, The Path to a High Performance U.S. Health System: A 2020 Vision and the Policies to Pave the Way (New York: The Commonwealth Fund, Feb. 2009).
Exhibit 12. Total National Health Expenditure (NHE) Growth byProvider Group, Current Projections and with Policy Changes, 2009–2020 Total NHE All other Physician & other professional Hospital Projected Growth, Current Policy Revenue Growth with Path Policies Expenditure (trillions) Expenditure (trillions) Data: Estimates by The Lewin Group for The Commonwealth Fund. Source: The Commonwealth Fund Commission on a High Performance Health System, The Path to a High Performance U.S. Health System: A 2020 Vision and the Policies to Pave the Way (New York: The Commonwealth Fund, Feb. 2009).
Exhibit 13. Total National Health Expenditure Growth for Hospitals and Physicians, Current Projections and with Policy Changes, 2009–2020 Hospital Expenditures (trillions) Physician Expenditures (trillions) $1.6 $1.4 $1.3 $1.1 $0.8 $0.7 Data: Estimates by The Lewin Group for The Commonwealth Fund. Source: The Lewin Group, The Path to a High Performance U.S. Health System: Technical Documentation (Washington, D.C.: The Lewin Group, 2009).
Exhibit 14. Provider Payments as a Percent of Medicare Payments for Similar Services Hospital Care Physician Care Data: American Hospital Association, MedPAC, Kaiser Family Foundation. Source: The Lewin Group, The Path to a High Performance U.S. Health System: Technical Documentation (Washington, D.C.: The Lewin Group, 2009).
Exhibit 15. Expenditures for Health Services by Type of Service and Source of Funds, 2007 (billions) Out-of-pocket $23b 3% Out-of-pocket $50b 10% Medicaid $33b 7% Other public $32b 7% Other public $68b 10% Medicaid $120b 17% Private $257b 37% Medicare $96b 20% Private $237b 49% Medicare $196b 28% Hospital Care Total: $697b Physician and Clinical Services Total: $479b Source: M. Hartman, A. Martin, P. McDonnell et al., “National Health Spending in 2007: Slower Drug Spending Contributes to Lowest Rate of Overall Growth Since 1998,” Health Affairs, Jan./Feb. 2009 28(1):246–61.