Download
1 / 43
430 likes | 607 Views
Exhibit ES-1. Total National Health Expenditures (NHE), 2009–2020 Current Projection and Alternative Scenarios. NHE in trillions. Cumulative reduction in NHE through 2020: $3 trillion. Note: GDP = Gross Domestic Product. Data: Estimates by The Lewin Group for The Commonwealth Fund.

E N D
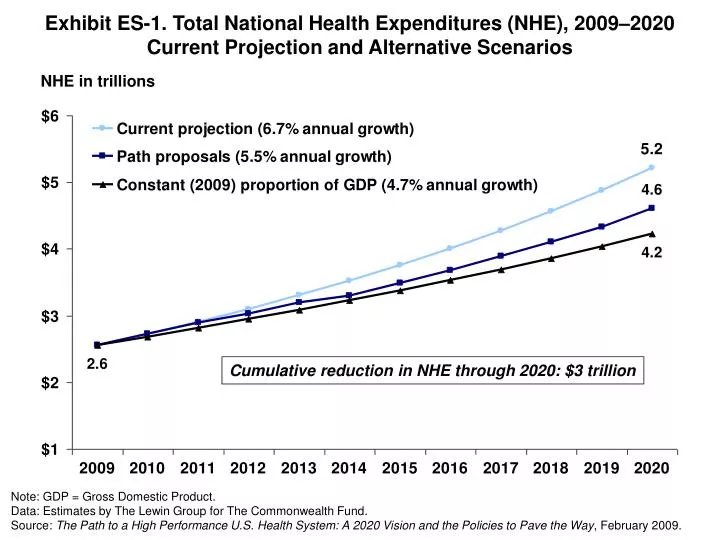
Exhibit ES-1. Total National Health Expenditures (NHE), 2009–2020Current Projection and Alternative Scenarios NHE in trillions Cumulative reduction in NHE through 2020: $3 trillion Note: GDP = Gross Domestic Product. Data: Estimates by The Lewin Group for The Commonwealth Fund. Source: The Path to a High Performance U.S. Health System: A 2020 Vision and the Policies to Pave the Way, February 2009.
Exhibit ES-2. Trend in the Number of Uninsured, 2009–2020 Under Current Law and Path Proposal Millions Note: Assumes insurance exchange opens in 2010 and take up by uninsured occurs over two years. Remaining uninsured are mainly non-tax-filers. Data: Estimates by The Lewin Group for The Commonwealth Fund. Source: The Path to a High Performance U.S. Health System: A 2020 Vision and the Policies to Pave the Way, February 2009.
ExhibitES-3.MajorSourcesofSavingsComparedwithProjectedSpending, Net Cumulative Reduction of National Health Expenditures, 2010–2020 Data: Estimates by The Lewin Group for The Commonwealth Fund. Source: The Path to a High Performance U.S. Health System: A 2020 Vision and the Policies to Pave the Way, February 2009.
Exhibit ES-4. Estimated Premiums for New Public PlanCompared with Average Individual/Small Employer Private Market, 2010 Average annual premium for equivalent benefits at community rate* Public plan premiums 20%–30% lower than traditional fee-for-service insurance * Benefits used for modeling include full scope of acute care medical benefits; $250 individual/$500 family deductible; 10% coinsurance for physician service; 25% coinsurance and no deductible for prescription drugs; reduced for high-value medications; full coverage checkups/preventive care. $5,000 individual/$7,000 family out-of-pocket limit. Note: Premiums include administrative load. Data: Estimates by The Lewin Group for The Commonwealth Fund. Source: The Path to a High Performance U.S. Health System: A 2020 Vision and the Policies to Pave the Way, February 2009.
Exhibit ES-5. Achieving Benchmarks:Potential People Impact if the United States ImprovedNational Performance to the Level of the Benchmark * Targets are benchmarks of top 10% performance within the U.S. or top countries(mortality amenable and electronic medical records). All preventive care is a target. Source: Commonwealth Fund Commission on a High Performance Health System, Why Not the Best? Results from the National Scorecard on U.S. Health System Performance, 2008 (New York: The Commonwealth Fund, July 2008), with benchmarks from top performance.
Exhibit ES-6. Total National Health Expenditure (NHE) Growth byProvider Sector, Current Projections and with Policy Changes, 2009–2020 Total NHE All other Physician & other professional Hospital Projected Growth, Current Policy Revenue Growth with Path Policies Expenditure (trillions) Expenditure (trillions) Data: Estimates by The Lewin Group for The Commonwealth Fund. Source: The Path to a High Performance U.S. Health System: A 2020 Vision and the Policies to Pave the Way, February 2009.
Exhibit ES-7. Path Net Cumulative Impact on National Health Expenditures (NHE) 2010–2020 Compared with Baseline, by Major Payer Groups Dollars in billions Note: A negative number indicates spending decreases compared with projected expenditures (i.e., savings);a positive indicates spending increases. Data: Estimates by The Lewin Group for The Commonwealth Fund. Source: The Path to a High Performance U.S. Health System: A 2020 Vision and the Policies to Pave the Way, February 2009.
Exhibit ES-8. Savings Can Offset Federal Costs of Insurance:Federal Spending Under Two Scenarios Dollars in billions Data: Estimates by The Lewin Group for The Commonwealth Fund. Source: The Path to a High Performance U.S. Health System: A 2020 Vision and the Policies to Pave the Way, February 2009.
Exhibit 1 International Comparison of Spending on Health, 1980–2006 Average spending on health per capita ($US PPP*) * PPP = Purchasing Power Parity. Data: OECD Health Data 2008, June 2008 version.
Exhibit 2 Mortality Amenable to Health Care: U.S. Failing to Keep Pace with Other Countries Deaths per 100,000 population* * Countries’ age-standardized death rates before age 75; including ischemic heart disease, diabetes, stroke, and bacterial infections. Data: E. Nolte and C. M. McKee, London School of Hygiene and Tropical Medicine analysis of World Health Organization mortality files (Nolte and McKee, Health Affairs 2008). Source: Commonwealth Fund National Scorecard on U.S. Health System Performance, 2008.
Exhibit 3 Failure to Improve: National Scorecard onU.S. Health System Performance Source: Commonwealth Fund National Scorecard on U.S. Health System Performance, 2008.
Exhibit 4 Uninsured Projected to Rise to 61 Million by 2020Not Counting Underinsured or Part-Year Uninsured Number of uninsured, in millions Projected Lewin estimates Data: U.S. Census Bureau, Current Population Survey, Annual Social and Economic Supplement, 2001 and 2006; Projections to 2020 based on estimates by The Lewin Group.
Exhibit 5 Two of Five Adults Uninsured or Underinsured 25 Million Underinsured60 Percent Increase in Underinsured from 2003 to 2007 Percent of adults (ages 19–64) who are uninsured or underinsured 72 68 42 35 27 17 Total Under 200% of poverty 200% of poverty or more * Underinsured defined as insured all year but experienced one of the following: medical expenses equaled 10% or more of income, or 5% or more of income if low-income (<200% of poverty); or deductibles equaled 5% or more of income. Data: 2003 and 2007 Commonwealth Fund Biennial Health Insurance Survey. Source: Commonwealth Fund National Scorecard on U.S. Health System Performance, 2008.
Exhibit 6 Cost-Related Access Problems Among the Chronically Ill, in Eight Countries, 2008 Base: Adults with any chronic condition Percent reported access problem because of cost in past two years* * Because of cost, respondent did NOT: fill Rx or skipped doses, visit a doctor when had a medical problem, and/or get recommended test, treatment, or follow-up. Data: 2008 Commonwealth Fund International Health Policy Survey of Sicker Adults. Source: C. Schoen, R. Osborn, S. K. H. How et al., “In Chronic Condition: Experiences of Patients with Complex Health Care Needs, in Eight Countries, 2008,” Health Affairs Web Exclusive (Nov. 13, 2008):w1–w16.
Exhibit 7 Medical Bill Problems andAccrued Medical Debt, 2005–2007 Percent of adults ages 19–64 Data: 2005 and 2007 Commonwealth Fund Biennial Health Insurance Surveys Source: S. R. Collins et al., Losing Ground: How the Loss of Adequate Health Insurance Is Burdening Working Families—Findings from the Commonwealth Fund Biennial Surveys, 2001–2007, The Commonwealth Fund, August 2008.
Your specialist did not receive basic medical information from your primary care doctor Your primary care doctor did not receive a report back from a specialist Test results/medical records were not available at the time of appointment Doctors failed to provide important medical information to other doctors or nurses you think should have it No one contacted you about test results, or you had to call repeatedly to get results Any of the above Exhibit 8 Poor Coordination: Nearly Half Report Failures to Coordinate Care Percent U.S. adults reported in past two years: Source: Commonwealth Fund Survey of Public Views of the U.S. Health Care System, 2008.
Exhibit 9 Cumulative Changes in Components ofU.S. National Health Expenditures and Workers’ Earnings, 2000–2008 Percent 106% 75% 47% 29% * 2007 and 2008 NHE projections. Data: Authors’ calculations based on A. Catlin et al., “National Health Spending in 2006,” Health Affairs, Jan./Feb. 2008; and S. Keehan et al., “Health Spending Projections Through 2017,” Health Affairs Web Exclusive (Feb. 26, 2008). Workers’ earnings from Henry J. Kaiser Family Foundation/Health Research and Educational Trust, Employer Health Benefits Annual Surveys, 2000–2008.
Exhibit 10 Total National Health Expenditures (NHE), 2009–2020Current Projection and Alternative Scenarios NHE in trillions Cumulative reduction in NHE through 2020: $3 trillion Note: GDP = Gross Domestic Product. Data: Estimates by The Lewin Group for The Commonwealth Fund. Source: The Path to a High Performance U.S. Health System: A 2020 Vision and the Policies to Pave the Way, February 2009.
Exhibit 11 Trend in the Number of Uninsured, 2009–2020 Under Current Law and Path Proposal Millions Note: Assumes insurance exchange opens in 2010 and take-up by uninsured occurs over two years. Remaining uninsured are mainly non-tax-filers. Data: Estimates by The Lewin Group for The Commonwealth Fund. Source: The Path to a High Performance U.S. Health System: A 2020 Vision and the Policies to Pave the Way, February 2009.
Exhibit 12 Major Sources of Savings Compared with Projected Spending, Net Cumulative Reduction of National Health Expenditures, 2010–2020 Data: Estimates by The Lewin Group for The Commonwealth Fund. Source: The Path to a High Performance U.S. Health System: A 2020 Vision and the Policies to Pave the Way, February 2009.
Exhibit 13 Cumulative Savings of Coverage, Payment, and System Reform Policies on National Health Expenditures Compared with Baseline, 2010–2020 Dollars in billions Data: Estimates by The Lewin Group for The Commonwealth Fund. Source: The Path to a High Performance U.S. Health System: A 2020 Vision and the Policies to Pave the Way, February 2009.
Exhibit 14 Benefit Design for Medicare-Sponsored Public PlanOffered in Insurance Exchange * Basic benefits before Medigap. ** Part D coverage varies, often deductible. Most have “doughnut” hole and use tiered, flat-dollar copayments. Note: Benefit design also would apply to Medicare Extra supplement option available to Medicare beneficiaries. Source: The Path to a High Performance U.S. Health System: A 2020 Vision and the Policies to Pave the Way, February 2009.
Exhibit 15 Path to High Performance Foundation:Automatic and Affordable Health Insurance for All in 2010 New Coverage for 45 Million Uninsured 19m 13m <1m 12m Employer Group Coverage TOTAL= 147m National Insurance Exchange TOTAL= 65m Medicaid/ SCHIP TOTAL= 50m Medicare TOTAL= 41m 7m 1m 45m 3m Improved or More Affordable Coverage for 57 Million Insured Data: Estimates by The Lewin Group for The Commonwealth Fund. Source: The Path to a High Performance U.S. Health System: A 2020 Vision and the Policies to Pave the Way, February 2009.
Exhibit 16 Estimated Premiums for New Public PlanCompared with Average Individual/Small Employer Private Market, 2010 Average annual premium for equivalent benefits at community rate* Public plan premiums 20%–30% lower than traditional fee-for-service insurance * Benefits used for modeling include full scope of acute care medical benefits; $250 individual/$500 family deductible; 10% coinsurance for physician service; 25% coinsurance and no deductible for prescription drugs; reduced for high-value medications; full coverage checkups/preventive care. $5,000 individual/$7,000 family out-of-pocket limit. Note: Premiums include administrative load. Data: Estimates by The Lewin Group for The Commonwealth Fund. Source: The Path to a High Performance U.S. Health System: A 2020 Vision and the Policies to Pave the Way, February 2009.
Exhibit 17 Current Coverage and Estimated Distribution with Insurance Exchange, New Public Plan, Market Reforms, and Individual Mandate, 2010 * Modeling estimates about one-third would enroll in private plans and two-thirds in the public plan, if private plans are unable to reduce the premium differential. ** Employer includes active employees, retirees, and TRICARE. *** Medicare includes those dually eligible for Medicaid and Medicare. Note: The exchange would initially be open to small firms in 2010, to firms with less than 500 employees in 2012, and to all employers in 2014. For purposes of comparison, above estimates are based on population distribution in 2010. Data: Estimates by The Lewin Group for The Commonwealth Fund. Source: The Path to a High Performance U.S. Health System: A 2020 Vision and the Policies to Pave the Way, February 2009.
Exhibit 18 Organization and Payment Methods Global payment per enrollee Global DRG case rate, hospital, and post-acute care Global DRG case rate, hospital only Global fee for primary care Blended fee-for-service/medical home fee Fee-for-service Outcome measures Care coordination and intermediate outcome measures Simple process and structure measures Less Feasible Continuum of Payment Bundling More Feasible Independent physician practices and hospitals Primary care group practices Hospital systems Integrateddelivery systems Continuum of Organization Source: The Path to a High Performance U.S. Health System: A 2020 Vision and the Policies to Pave the Way, February 2009.
Patients Primary Care Physician Specialist Physician Tertiary Hospital Community Hospital Long-term Care Pharma-ceuticals Exhibit 19 Delivery System Models for Care Coordination • Incentives for public and private insurance enrollees to designate medical home with: • an advanced primary care practice; • a group practice; or • an integrated delivery system • New payment methods for delivery systems assuming accountability for total patient care, patient outcomes, and resource use • Performance standards for each of these delivery systems • Funding for regional or state efforts to provide primary care practices with: • IT network portal and IT support; • case management support; • after-hours access; • QI and care redesign; and • data reporting and profiling feedback Health Care Delivery System Integrated Delivery System Group Practice Advanced Primary Care Practice Patient/Family Arranging Care Source: The Path to a High Performance U.S. Health System: A 2020 Vision and the Policies to Pave the Way, February 2009.
Exhibit 20 Health Information Technology • Goal: Accelerate the adoption and use of effective health information technology with capacity for decision support and information exchange across care sites. • Why? To improve care outcomes, safety, and value • Information flow with patients—patient-centered care • Connect care: reduce duplication and enhance coordination • Decision support • Facilitate standards, recommended care, reporting and transparency • Accelerate Adoption and Use • Require electronic reporting of clinical information—use payment incentives • Initial funding to support spread to safety net and set up exchange • Establish national entity for standards and electronic exchange • Standards of information—type of information; minimum elements • Standards of privacy • Technical standards for transferable, interoperable information Source: The Path to a High Performance U.S. Health System: A 2020 Vision and the Policies to Pave the Way, February 2009.
Exhibit 21 Center for Comparative Effectiveness • Goal: Establish a Center for Comparative Effectiveness to provide better information about what works well for which patients • Would operate with national priorities for evidence • Priorities set national policy • Responsibility • Review/synthesize existing evidence plus contract for scientific research (outcomes and costs) • Analysis of existing clinical processes of care as well as new technology • Makes recommendations to insurers (public and private) regarding benefit design and pricing/payment policy • Independent and trusted source • First-rate science, technical expertise • Efficient process to diffuse to clinicians and publish • Independent: operates in public interest • Budget for staff and research Source: The Path to a High Performance U.S. Health System: A 2020 Vision and the Policies to Pave the Way, February 2009.
Exhibit 22 All-Population Data with Benchmarks • All-population, all-patient, all-payer data • Ideally would include care process, clinical outcomes, patient experiences, and costs and enable benchmarking and monitoring changes • Minimum uniform set, including all-payers • Health outcomes (e.g., percent diabetes under control; cancer survival rates) • Data flow from HIT capacity to report outcomes • Web comparison of insurance choices, costs and benefits, experiences; include share of premium for administrative/overhead/profit • National with capacity for state or geographic analysis and benchmarks • Designed so states could add, build with more detailed data where available • Could build up or incorporate from existing state database efforts • Build on existing national and state efforts • Transparent with capacity to benchmark and compare, monitoring changes over time Source: The Path to a High Performance U.S. Health System: A 2020 Vision and the Policies to Pave the Way, February 2009.
Exhibit 23 Path Net Cumulative Impact on National Health Expenditures(NHE) 2010–2020 Compared with Baseline, by Major Payer Groups Dollars in billions Note: A negative number indicates spending decreases compared with projected expenditures (i.e., savings); a positive indicates spending increases. Data: Estimates by The Lewin Group for The Commonwealth Fund. Source: The Path to a High Performance U.S. Health System: A 2020 Vision and the Policies to Pave the Way, February 2009.
Exhibit 24 Change in Average Annual Family Health Spending Under Path Proposal Compared with Projected Without Reforms: Average Savings per Family Note: Family income in 2010 dollars. By 2020, total household savings would reach an estimated $342 billion. The estimated savings per family in 2020 use the same family distribution as in 2010 and adjust for population growth. Data: Estimates by The Lewin Group for The Commonwealth Fund. Source: The Path to a High Performance U.S. Health System: A 2020 Vision and the Policies to Pave the Way, February 2009.
Exhibit 25 Savings Can Offset Federal Costs of Insurance: Federal Spending Under Two Scenarios Dollars in billions Data: Estimates by The Lewin Group for The Commonwealth Fund. Source: The Path to a High Performance U.S. Health System: A 2020 Vision and the Policies to Pave the Way, February 2009.
Exhibit 26 Potential Federal Revenues Options to Fund Insurance Expansion: 2010–2020, Cumulative Revenue in $ Billions * The top bracket reduced rate is due to expire at the end of 2010. This would let it expire one year early. ** These financing sources were already included in the modeling estimates. Data: Estimates by The Lewin Group for The Commonwealth Fund. Source: The Path to a High Performance U.S. Health System: A 2020 Vision and the Policies to Pave the Way, February 2009.
Exhibit 27 Total National Health Expenditure (NHE) Growth byProvider Sector, Current Projections and with Policy Changes, 2009–2020 Total NHE All other Physician & other professional Hospital Projected Growth, Current Policy Revenue Growth with Path Policies Expenditure (trillions) Expenditure (trillions) Data: Estimates by The Lewin Group for The Commonwealth Fund. Source: The Path to a High Performance U.S. Health System: A 2020 Vision and the Policies to Pave the Way, February 2009.
Exhibit 28 Three Insurance Exchange Scenarios:Cumulative 11-Year Savings in National Health Expenditures, 2010–2020 Cumulative National Health Expenditures Savings compared with baseline (trillions) Data: Estimates by The Lewin Group for The Commonwealth Fund. Source: The Path to a High Performance U.S. Health System: A 2020 Vision and the Policies to Pave the Way, February 2009.
Exhibit 29 Achieving Benchmarks:Potential People Impact if the United States ImprovedNational Performance to the Level of the Benchmark * Targets are benchmarks of top 10% performance within the U.S. or top countries(mortality amenable and electronic medical records). All preventive care is a target. Source: Commonwealth Fund Commission on a High Performance Health System, Why Not the Best? Results from the National Scorecard on U.S. Health System Performance, 2008 (New York: The Commonwealth Fund, July 2008), with benchmarks from top performance.
Exhibit 30 New National Policy Leadership HealthInformationTechnology InsuranceExchangeand MarketReforms All-PopulationData andTransparency Center forComparativeEffectiveness MedicarePaymentReform Source: The Path to a High Performance U.S. Health System: A 2020 Vision and the Policies to Pave the Way, February 2009.
Exhibit A-1. Cost of Administering Health Insurance as a Percentage of Claims Under Current Law and the Proposed Exchange, by Group Size Note: Only small firms are permitted to enter the exchange, which we assume includes firms with fewer than 25 workers. * Self-funded plans pay a fee of about $6 per worker per month. Assumes that all firms with 2,500 or more workers are self-funded. Data: Estimates by The Lewin Group for The Commonwealth Fund. Analysis of the Effect of Creating a Mandatory Insurance Pool developed by the Hay Group, “Cost and Effects of Extending Health Insurance Coverage,” Congressional Research Service 1990. Source: The Lewin Group, The Path to a High Performance U.S. Health System: Technical Documentation, February 2009, 13–14.
Exhibit A-2. Net Impact of Insurance Reform Policies Alone,Including Exchange and Public Plan, By Major Payer Groups Data: Estimates by The Lewin Group for The Commonwealth Fund. Source: The Path to a High Performance U.S. Health System: A 2020 Vision and the Policies to Pave the Way, February 2009.
Exhibit A-3. Net Impact of Insurance, Payment,and System Reform Policies, by Major Payer Groups Data: Estimates by The Lewin Group for The Commonwealth Fund. Source: The Path to a High Performance U.S. Health System: A 2020 Vision and the Policies to Pave the Way, February 2009.
Exhibit A-4. Sources of Path Savings, Net Impact by Payer and National Health Expenditures: Insurance Alone and All Reforms, 2010–2020 Data: Estimates by The Lewin Group for The Commonwealth Fund. Source: The Path to a High Performance U.S. Health System: A 2020 Vision and the Policies to Pave the Way, February 2009.
Exhibit A-5. Savings Can Offset Federal Costs of Insurance:Federal Spending Under Two Scenarios Billions $1.3 trillion offsetting savings from reform measures Data: Estimates by The Lewin Group for The Commonwealth Fund. Source: The Path to a High Performance U.S. Health System: A 2020 Vision and the Policies to Pave the Way, February 2009.