Download
1 / 25
250 likes | 250 Views
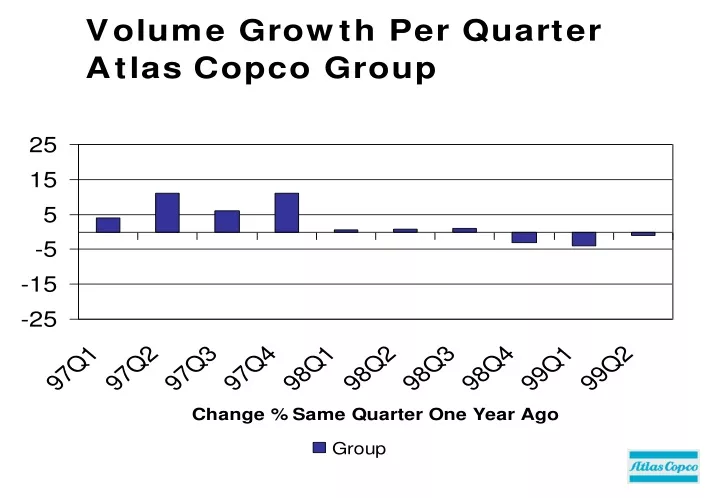
Comparison of Atlas Copco Group's orders received in the first quarter and first half of the year, with changes in value and percentage. Includes data on different business areas and geographical regions.

E N D
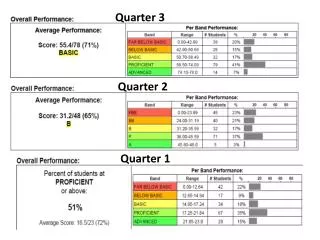
Orders Received Comparison Q1 and H1 Group, First Quarter 8,156 MSEK -3% Group, First Half-year 16,900 MSEK 0% -6 -10 -26 -41 +4 +6 +10 +13 -20 -6 -26 -21 -19 -11 -40 -32 -29 -19 -18 -15 Change in value 1st Quarter, 1999 / 1998 Change in value 1st Half-year, 1999 / 1998
AtlasCopco Group Orders Received (Jan - June) Group total 16,900 MSEK 0% 6 -10 2 -41 32 +6 40 +13 2 -6 2 -21 6 -11 4 -32 3 -19 3 -15 Portion of Group Sales Change in value 1999 / 1998
AtlasCopco Group Jan - June 1998 Jan - June 1999 SEKm Change % Q2 -98 Q2 -99 Change % Orders Received Orders Invoiced EBIT EBIT margin, % 16,913 16,784 2,155 12.8 16,900 16,370 1,787 10.9 0 -2 -17 8,509 8,676 1,112 12.8 8,744 8,619 1,062 12.3 3 -1 -5
AtlasCopco Group Earnings by business areas as at June 30 SEKm Margin 1998 1999 1998 1999 Compressor Technique Construction & Mining Industrial Technique Rental Service Corporate items EBIT Financial items Profit after fin. Items Taxes Minority Net profit 1,202 259 524 220 -50 2,155 -331 1,824 -647 -13 1,164 962 188 473 229 -65 1,787 -362 1,425 -481 -9 935 17.6 7.9 10.6 11.9 12.8 10.9 6.9 15.0 6.6 9.3 10.0 10.9 8.7 5.7
Compressor Technique AtlasCopco Group Jan - June 1998 Jan - June 1999 SEKm Change % Q2 -98 Q2 -99 Change % Orders Received Orders Invoiced EBIT EBIT margin, % 6,868 6,844 1,202 17.6 6,604 6,393 962 15.0 -4 -7 -20 3,384 3,460 595 17.2 3,433 3,422 572 16.7 1 -1 -4
Construction & Mining Technique AtlasCopco Group Jan - June 1998 Jan - June 1999 SEKm Change % Q2 -98 Q2 -99 Change % Orders Received Orders Invoiced EBIT EBIT margin, % 3,365 3,295 259 7.9 3,027 2,830 188 6.6 -10 -14 -27 1,745 1,816 155 8.5 1,582 1,477 104 7.0 -9 -19 -33
Industrial Technique AtlasCopco Group Jan - June 1998 Jan - June 1999 SEKm Change % Q2 -98 Q2 -99 Change % Orders Received Orders Invoiced EBIT EBIT margin, % 4,991 4,955 524 10.6 5,274 5,093 473 9.3 6 3 -10 2,494 2,510 264 10.5 2,664 2,645 257 9.7 7 5 -3
Rental Service AtlasCopco Group Jan - June 1998 Jan - June 1999 SEKm Change % Q2 -98 Q2 -99 Change % Orders Received Orders Invoiced EBIT EBIT margin, % 1,842 1,847 220 11.9 2,282 2,284 229 10.0 24 24 4 964 969 123 12.7 1,197 1,202 146 12.1 24 24 19
AtlasCopco Group Jan - Dec % of NIS Profit after financial items& Profit margin SEKm 11.7 11.6 10.8 10.1 8.7 6.8 7.0 6.0 1987 1989 1991 1993 1997 1999 June 1995
AtlasCopco Group 12 month values Taxes 36.1 36.4 36.3 35.7 34.9 July - June 1995 1996 1997 1998 98/99
AtlasCopco Group SEKm Balance sheet as at June 30 SEKm 1998 % 1999 % SEKm 1998 % 1999 % Intangible ass. Fixed assets Inventories Receivables Other rec. Cash & Bank Total 11,032 9,888 5,460 6,567 1,073 1,915 35,935 31 28 15 18 3 5 11,617 10,893 5,351 6,754 1,149 1,463 37,227 31 29 14 18 3 5 Equity Minority int. Int. bearing liab. & prov. Non int. bear. liab. & prov. Total 13,801 183 12,581 9,370 35,935 38 1 35 26 15,363 190 11,790 9,884 37,227 41 1 32 26
AtlasCopco Group Capital expenditures in tangible fixed assets SEKm 1995 1996 1997 1998 1999
AtlasCopco Group 12 month values Inventories & Customer receivablesas percent of sales 19.6 20.2 20.3 19.4 19.8 19.0 17.8 17.4 16.0 16.1 July - June 1995 1996 1997 1998 98/99
AtlasCopco Group Cash and Interest bearing debt as at June SEKm Cash Short-term loans 2,370 1,773 4,317 2,802 1,913 2,534 2,759 2,195 1,915 5,352 1,463 4,823 1,911 1,946 1,998 1,934 5,188 5,553 Long-term loans Pensions 1,414 2,041 Net borrowings 1,525 3,092 2,062 10,666 10,327 518 1994 1996 1997 1998 1999 1995
AtlasCopco Group Jan - June Cash flow SEKm 1998 1999 Operating cash surplus after tax Of which depreciation added back Change in working capital Cash flow from operations Investments in tangible fixed assets Sale of tangible fixed assets Company acquisitions / divestments Cash flow from investments Cash flow after net investments Dividend paid Net Cash flow Change in interest-bearing liabilities Cash flow after financing Liquid funds at year start Translation difference Liquid funds at period end 1,717 920 -502 -1,043 497 -275 -821 -780 690 1,613 -15 1,902 1,215 -394 -386 304 1,796 968 169 -1,089 381 -111 -819 -829 -930 2,118 -42 1,463 1,965 1,146 317 -613
AtlasCopco Group Profit per Share quarterly and 12 month values SEK 12:44 12:03 11:19 10:56 9:93 3:40 3:36 3:06 3:28 3:18 3:14 2:94 2:87 2:92 2:61 2:64 2:63 2:82 2:23 2:45 2:40 2:17 1:95 1995 1996 1997 1998 1999
AtlasCopco Group August 1999 Industrial and Geographical Demand Outlook Weight by Industry Weight by Region Others Africa/Middle East 4% 5% Asia/Australia Process 15% 9% South America 3% Mining 10% North America 48% Automotive 10% Mechanical 20% Construction 40% Europe 36% Total Demand Outlook
AtlasCopco Group August 1999 Atlas Copco’s “Six Demand Keys” Expendables and After Market 55% Capital Goods 45% Industry Industrial Machine Investment Industrial Production Mining Mining Machine Investment Metal Ore Production Construction Public Investment Construction Activity Total Demand Outlook