Download
1 / 44
460 likes | 500 Views
Fixed and Random Effects. Theory of Analysis of Variance. [ e 2 + k t 2 ]/ e 2 = 1, if k t 2 = 0. Expected Mean Squares. Dependant on whether factor effects are Fixed or Random. Necessary to determine which F-tests are appropriate and which are not. Setting Expected Mean Squares.

E N D
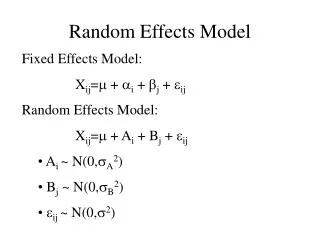
Theory of Analysis of Variance [e2 + kt2]/e2 = 1, if kt2 = 0
Expected Mean Squares • Dependant on whether factor effects are Fixed or Random. • Necessary to determine which F-tests are appropriate and which are not.
Setting Expected Mean Squares • The expected mean square for a source of variation (say X) contains. • the error term. • a term in 2x. • a variance term for other selected interactions involving X.
Coefficients for EMS Coefficient for error mean square is always 1 Coefficient of other expected mean squares is # reps times the product of factors levels that do not appear in the factor name.
Expected Mean Squares • Which interactions to include in an EMS? • All the factors appear in the interaction. • All the other factors in the interaction are Random Effects.
Example • Ten yellow mustard lines. • Five different nitrogen levels (50, 75, 100, 125, 150 units of N). • Three replicates. • Raw data presented in Table 7 (Page 110 & 111)
Another Example • Four species of Brassica. • Ten lines within each species. • Three insecticide treatments (Thiodan, Furidan, none). • Three replicates. • Raw data in Table 8.