Download
1 / 52
520 likes | 689 Views
Communication between Fixed and Random Effects: Examples from Dyadic Data. David A. Kenny University of Connecticut davidakenny.netkenny.htm. Overview. I. Introduction: Dyadic Designs and Models II. Specification Error III. Respecifying Fixed Effects Based on the Random Effects

E N D
Communication between Fixed and Random Effects: Examples from Dyadic Data • David A. Kenny • University of Connecticut davidakenny.net\kenny.htm
Overview I.Introduction: Dyadic Designs and Models II. Specification Error III. Respecifying Fixed Effects Based on the Random Effects IV. Resolving an Inconsistency
Caveat Linear Models Normally Distributed Random Variables
Three Major Dyadic Designs • Standard • Each person has one partner. • Married couples • Social Relations Model (SRM) Designs • Each person has many partners, and each partner is paired with many persons. • Group members state liking of each other. • One-with-Many • Each person has many partners, but each partner is paired with only one person. • Patients rate satisfaction with the physician.
Model for the Standard Design Two scores for dyad j: Y1j = b01 + b11X11j + e1j Y2j = b02 + b12X12j + e2j where C(e1j, e1j) may be nonzero
Members Indistinguishable Y1j = b0 + b1X11j + e1j Y2j = b0 + b1X12j + e2j where V(e1j) = V(e2j) and C(e1j,e2j) may be nonzero
Partner Effect with Members Indistinguishable Y1j = b0 + b1X11j + b2X12j + e1j Y2j = b0 + b1X12j + b2X11j + e2j where V(e1j) = V(e2j) and C(e1j,e2j) may be nonzero
Partner Effects with Members Distinguishable Y1j = b01 + b11X1j + b21X2j + e1j Y2j = b02 + b12X2j + b22X1j + e2j where C(e1j, e1j) may be nonzero
Social Relations Model • model of dyadic relations embedded in groups • Xijk: actor i with partner j in group k • round-robin structures: everyone paired with everyone else • other structures possible
Round Robin Design Partner 1 2 3 4 5 6 1 - x x x x x 2 x - x x x x 3 x x - x x x 4 x x x - x x 5 x x x x - x 6 x x x x x - A c t o r
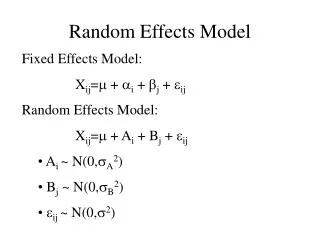
The Statistical Model: Random Effects Xijk = mk + aik + bjk + gijk variances (4): sm2, sa2, sb2, sg2 covariances (2): sab, sgg (fixed effects discussed later)
Liking: How much Dave likes Paul Variances Group (sm2): How much liking there is in the group. Actor (sa2): How much Dave likes others in general. Partner (sb2): How much Paul is liked by others in general. Relationship (sg2): How much Dave particularly likes Paul.
Liking: How much Dave likes Paul Covariances: Actor-Partner (sab): If Dave likes others, is Dave liked by others? Relationship (sgg): If Dave particularly likes Paul, does Paul particularly like Dave?
Estimation ANOVA Expected Mean Squares (Warner, Kenny, & Stoto, JPSP, 1979) Maximum likelihood (Wong, JASA, 1982) Bayesian estimation and fixed effects (Gill & Swartz, The Canadian Journal of Statistics, 2001) Estimation with triadic effects (Hoff, JASA, 2005)
Consensus and Acquaintance • We would think that we would agree more about targets the longer we know them. • Evidence (Kenny et al., 1994) does not support this hypothesis. • Measure: sg2/(sa2 + sb2 + sg2)
Model for the One-with-Many Design Person i (the one of nj persons) is paired with person j (the many): Yij = b0j + b1X1ij + ejj where V(b0j) may be nonzero
Model for the One-with-Many Design Person i (the one of nj persons) is paired with person j (the many): Yij = b0j + b1jX1ij + eij where V(b0j), V(b1j), and C(b0j, b1j) may be nonzero
II. Specification Error How does specifying the wrong model in one part affect the other part?
Specification Error in the Random Part • Unbiased estimates of fixed effects. • Bias in standard errors • under-estimation • over-estimation • little or none
Example of Bias in Standard Errors Consider a standard dyad design and a simple model for person i (i =1, 2) in dyad j Yij = b0 + b1Xij + eij where C(X1j,X2j)/V(X) = rx and C(e1j, e2j)/V(e) = re.
Bias in Standard Error for b1 If re Is Falsely Assumed To Be Zero • under-estimation: rxre > 0 • over-estimation: rxre < 0 • none: rxre = 0
Specification Error in Fixed Part • can dramatically bias random effects • example: roommate effects and liking
Kenny & Lowe Study • 19 round robins of 4 • 2 pairs of roommates • Roommates like one another: Mean difference between roommates and non-roommates • What if the roommate effect were ignored?
Kenny & Lowe Study: Results Using ANOVA Component Estimate Actor -.754 Partner -.794 Relationship 3.693
Kenny & Lowe Study: Results Using ANOVA Component Estimate Revised Actor -.754 .444 Partner -.794 .597 Relationship 3.693 1.139
III. Respecifying Fixed Effects Based on Random Effects • A fixed effect often corresponds to certain random effect. • e.g., fixed effect at a given level • What if those random effects have zero variance? • May need to rethink the fixed effects.
Example • People like being in homogeneous groups. • Demographic homogeneity • Same ethnicity • Same gender • Same age • Opinion homogeneity • People do not like being in diverse groups.
Conclusion People do not like being in diverse groups. But is there group variance in liking?
Group Variance in Liking? • Liking tends not to show group effects • SRM analyses of lab groups • SRM studies of families • Rather the dominant component is relationship. • Group (?) diversity as a relationship effect?
The Measurement of Diversity • The usual measure of diversity is a variance or some related measure. • Not well known is that the variance can be expressed as the sum of squared differences: s2 = Si(Xi – M)2/(n – 1) = SiSj(Xi – Xj)2/[n(n - 1)] i > j
The Disaggregation of Group Diversity • Instead of thinking about diversity as a property of the group (i.e., a variance), we can view diversity as the set of relationships. • It then becomes an empirical question whether it makes sense to sum across different components.
Dyad Group Data • Group of Dave, Paul, Bengt, and Thomas • Dave states how much he likes Paul. • Dave: actor • Paul: partner • Bengt and Thomas: others
Model for Dyad Group Data Dyadic Similarity: How similar am I to Paul? Actor Similarity: How similar am I to others in the group? Partner Similarity: How similar is Paul to others in the group? Group: How similar are others to each other?
What Does Group Diversity Presume? • Presumes the four effects are of equal magnitude. • Predicts group similarity has an effect. • Presence of group variance.
Example • Harmon Hosch’s Data • Gathered in El Paso, Texas • 134 6-person juries from the jury pool • Mock jury case • Jurors rate how likeable the other jurors are. • Diversity in terms of initial verdict preference
Results: Random Effects Term Estimate SE sm2.000 ---- sa2 .165 .016 sb2 .045 .013 sg2 .477 .018 sab -.022 .012 sgg .047 .014
Results: Fixed Effects Term Estimate SE Diversity -.007 .009 More diversity, others seem less likeable.
Results: Fixed Effects Term Estimate SE Dyad .129 .015 Actor -.029 .041 Partner .006 .041 Group .005 .058 You see someone as likeable if they have the same opinion as you.
What Did We Learn? At least for the data set under consideration, it is not that group diversity leads to lower liking, but rather being similar to the other, a relationship effect, that leads to perceptions of likeability.
IV. Resolving an Inconsistency • It has just been argued that a fixed effect at one level should be “accompanied” by a random effect at that level. • Blind following of this approach can be problematic.
Statistical Logic Is Not Necessarily Logical • We might conclude that groups of various types of persons are different, even though groups may not be different. • For example, we often conclude women are better than men at understanding others (a fixed effect) while at the same time we conclude that people do not differ in understanding others (a random effect).
Model • two-level multilevel model • n people each judge m different targets, nm targets total • two types of judges: n/2 men and n/2 women Yij = b0 + b1Xj + qj + eij [qj is person, eij is target, and Xj(0, 1) is gender] (Simulation performed by Randi Garcia.)
Parameter Values Yij = b0 + b1Xj + qj + eij b0 = 0 and se2 = 1 Fixed effect is a medium effect size: d = .5. The fixed and random effects explain the “same” amount of variance.