Download
1 / 50
500 likes | 542 Views
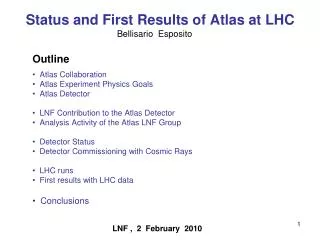
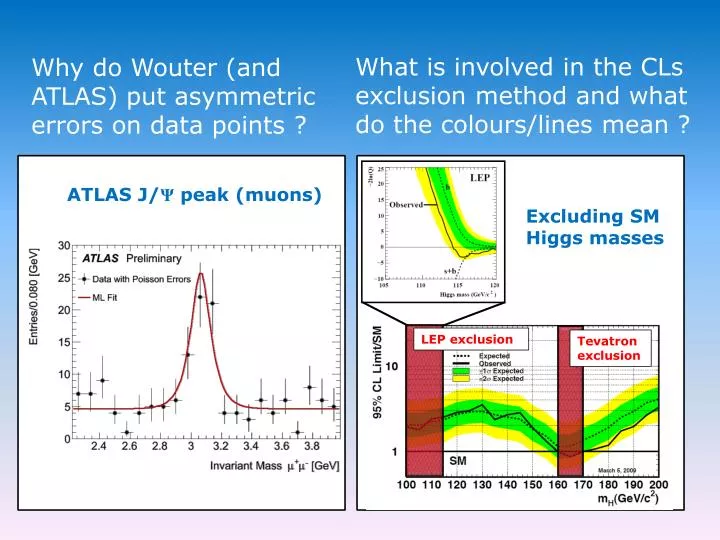
What is involved in the CLs exclusion method and what do the colours/lines mean ?. Why do Wouter (and ATLAS) put asymmetric errors on data points ?. ATLAS J/ Ψ peak (muons). Excluding SM Higgs masses. LEP exclusion. Tevatron exclusion. Why do you put an error on a data-point anyway ?.

E N D
What is involved in the CLs exclusion method and what do the colours/lines mean ? Why do Wouter (and ATLAS) put asymmetric errors on data points ? ATLAS J/Ψ peak (muons) Excluding SM Higgs masses LEP exclusion Tevatron exclusion
Why do you put an error on a data-point anyway ? ATLAS J/Ψ peak (muons) Estimate of underlying truth (model value)
Poisson distribution Probability to observe n eventswhen λare expected Poisson distribution Number of observed events λ=4.90 #observed Lambda hypothesis varying fixed
Poisson distribution: properties Poisson distribution http://www.nikhef.nl/~ivov/Statistics/Poisson.pdf properties (1) Mean: (2) Variance: (3) Most likely value: first integer ≤λ the famous √N
Lambda known expected # events λ=0.00 λ=1.00 λ=5.00 λ=4.90
Large number of events λ=40.0 Unfortunately this is not what you wanted to know … What you have: What you want:
From data to theory Likelihood: Poisson distribution “what can I say about the measurement (Number of observed events) given an expectation from an underlying theory ?” This is what you want to know: “what can I say about the underlying theory given my observation of a given number of events ?”
Nobs known (4) information on lambda “Given a number of observed events (4): what is the most likely / average / mean underlying true vanue of λ ?” Likelihood: P(Nobs=4|λ) λ (hypothesis) #observed Lambda hypothesis Normally you plot -2log(Likelihood) fixed varying
Properties of P(λ|N) for flat P(λ) http://www.nikhef.nl/~ivov/Statistics/Poisson.pdf Assuming P(λ) is flat properties (1) Mean: (2) Variance: (3) Most likely value: λmost likely = x
This is normally presented as likelihood curve Pdf for λ P(Nobs=4|λ) 68.4% λ (hypothesis) -2Log(Prob) -1.68 +2.35 Likelihood -2Log(P(Nobs=4|λ)) ΔL=+1 sigma: ΔL=+1 2.32 4.00 6.35
So, if you have observed 4 eventsyour best estimate for λ is … : ATLAS J/Ψ peak (muons)
CLS method http://www.nikhef.nl/~ivov/Statistics/thesis_I_v_Vulpen.pdf Chapter 7.4
Your Higgs analysis Scaled to correct cross-sections and 100 pb-1 SM+Higgs Higgs SM Higgs SM Discriminant variable Discriminant variable Hebben we nou de Higgs gezien of niet ? Can also be an invariant mass plot
Approach 1: counting Experiment 1 Experiment 2 tellen tellen Discriminant variable Discriminant variable
Expectations If the Higgs is there: On average 17.2 events If the Higgs is NOT there: On average 12.2 events SM SM + Higgs Experiment 1:11 events observed Experiment 2:17 events observed
Discovery - Only look at what you expect from Standard Model background • Given the SM expectation: if probability to observe as many events you have observed (or more) is smaller than 5.7 10-7 SM hypothesis is very unlikely reject SM discovery !
Test hypotheses: rules for discovery Integrate this plot SM SM + Higgs In the hypothesis that there is NO Higgs (SM hypothesis): What is the probability to observe as many events as I have observed …OR EVEN MORE If P < 5.7 10-7 reject SM P(N≥33|12.2) = 6.35 10-7 P(N≥34|12.2) = 2.24 10-7
Question 1: did you make a discovery ? See previous slide: Yes No Discovery No discovery
Question 2: did you expect to make a discovery: If the Higgs is there: On average 17.2 events If the Higgs is NOT there: On average 12.2 events If you observe exactly the number of events you expect (assuming the Higgs is there), it is not unlikely enough to be explained by the SM NO discovery expected SM SM + Higgs
Question 3: At what luminositydo you expect to make a discovery ? Lumi x 1 NSM = 12.2 NHiggs = 5.1 no SM + Higgs SM Lumi x 10 NSM = 122.0 NHiggs = 51.0 no SM SM + Higgs NSM = 152.5 NHiggs = 63.75 yes Lumi x 12.5
Discovery or not It is not likely you get exactly the number of events you expect. You can be lucky … or unlucky.
From simple counting to the real thing in 3 steps 1) Introduce X (Likelihood ratio) test statistic 2) From simple counting to weighted counting (a real analysis) 3) Toy Monte-Carlo (fake experiments)
From simple counting to the real thing in 3 steps 1) Introduce X (Likelihood ratio) test statistic 2) From simple counting to weighted counting (a real analysis) 3) Toy Monte-Carlo (fake experiments)
Hypothesis testing: likelihood ratio Hypothesis 1: the Standard Model without the Higgs boson Hypothesis 2:the Standard Model with the Higgs boson Definieer een statistic (= variabele) die onderscheid maakt tussen de 2 hypotheses. Note: kan vanalles zijn: # events of Neural net output. frequently used: X=-2ln(Q) Likelihood ratio Ex: counting experiment
Likelihood ratio: counting 14 events observed Counting experiment N events left after some a selection of cut on discriminant Variabele transformatie More SM+Higgs like More SM like Used in plots: 100.000 SM experiments Note: X = 0 means hypoteses equally likely 100.000 SM + Higgs experiments
Likelihood ratio: counting Counting experiment 15 events observed 14 events observed N events left after some a selection of cut on discriminant More SM+Higgs like More SM like Used in plots: 100.000 SM experiments Note: X = 0 means hypoteses equally likely 100.000 SM + Higgs experiments
From simple counting to the real thing in 3 steps 1) Introduce X (Likelihood ratio) test statistic 2) From simple counting to weighted counting (a real analysis) 3) Toy Monte-Carlo (fake experiments)
Likelihood ratio Counting experiment Weighted counting experiment Eveny event has a weight according to a NN output or discriminant called pi : Signal: S(pi) and Background B(pi) N events left after some a selection of cut on discriminant tellen B(pi) S(pi)+B(pi)
From simple counting to the real thing in 3 steps 1) Introduce X (Likelihood ratio) test statistic 2) From simple counting to weighted counting (a real analysis) 3) Toy Monte-Carlo (fake experiments)
Many possible experiments Experiment 1 Experiment 2 tellen tellen Discriminant variable Discriminant variable 1) Experiment condensed in 1 variable Note: Each experiment (read ATLAS) yields only ONE value of Q see 2 slides ago for counting example 2) Do Toy-MC experiments to study distribution of Q Note: Two distributions: for SM and SM+Higgs hypothesis
Toy Monte Carlo experiment λSM(i)+ λSM+Higgs(i) λSM(i) SM toy experiment: Draw for each bin i a random number from Poisson with μ= λSM (i) SM+Higgs toy experiment: Draw for each bin i a random number from Poisson with μ= λSM(i)+ λSM+Higgs(i)
The Higgs does not exist: 100,000 toy-experiments (SM) The Higgs exists: 100,000 toy-experiments (SM+Higgs)
With 1 and 2 sigma bands for SM hypothesis Note (again): each experiment will produce 1 (one) number in this plot
Different masses … different cross-sections Small Higgs cross-section Large Higgs cross-section Two hypotheses are more apart if: 1) cross-section of Higgs is larger 2) Higgs is more different from SM
dummy LEP plots Cross-section drops as function of mass LEP paper Fig 1 dummy dummy
Expectation for Q or -2ln (Q): toy experiments Clb = confidence level in the background Probability that background results in the numer observed or less SM SM+Higgs Probability that background resultsin the numer observed or (even) more If 1-CLb < 5.7 10-7 we can say we reject the SM hypothesis discovery ! The famous 5 sigma
Do you expect to discover Higgs with at this mass ? Average SM+Higgs experiment: 1-CLb = 2 10^-7 So yes, you expect to make a discovery IF 10xSM
The one 2-sigma is not the other 2-sigma 2.X sigma discrepancy at mh ~ 97 GeV Far away form what you expect from Higgs 1.X sigma away at mh = 114 GeV Exactly what you expect from Higgs No 5 sigma discovery what Higgs hypotheses can we reject
No discovery No 5 sigma deviation found … what now ? Trying to say something on the hypothesis that the Higgs exists exclusion
Exclusion - Look at what you expect from Standard Model +Higgs - Given the SM + Higgs expectation: if probability to observe as many events you have observed (or less) is smaller than 5% SM+Higgs hypothesis is not very likely reject SM+Higgs
Expectation for Q or -2ln (Q): toy experiments SM Probability that signal hypothesis results in the numer observed or less SM+Higgs Extra Normalisation: This is why it is called modified frequentist Cls = confidence level in the signal If CLs < 0.05 we are allowed to rejectthe SM+Higgs at 95% confidence level The famous 95% confidence level
Question 2: did you expect to be able to exclude ? CLs mean SM-only expeciment is 0.13 > 0.05 so NO !
Question 3: At what luminositydo you expect to make a discovery ? Lumi = 1x normal lumi CLs = 0.13 no exclusion for average SM-only experiment #SM = 100 #H = 10 Lumi = 2x normal lumi CLs = 0.034 exclusion for average SM-only experiment #SM = 200 #H = 20
A scan: 2 sigma up CLs = 0.66 CLs = 0.13 CLs = 0.046 1 sigma down Si: If you would have a 1 sigma downward fluctuation, i.e. you see less events than you expect there is less room for a SM+Higgs hypothesis. In this case you would have been able to exclude it. CLs CLs = 0.05 Luminosity / nominal luminosity You expect to be able to exclude at Lumi / Lumi nominal = 1.70
Question 4: At what Higgs xsdo you expect to make a discovery ? Higgs XS = 1x normal Higgs XS CLs = 0.13 no exclusion for average SM-only experiment #SM = 100 #H = 10 Higgs XS = 2x normal Higgs XS CLs = 0.006 exclusion for average SM-only experiment #SM = 100 #H = 20
A scan: 2 sigma up CLs = 0.66 CLs = 0.13 CLs = 0.046 1 sigma down CLs CLs = 0.05 Higgs XS / nominal Higgs XS You expect to be able to exclude at Higgs XS / Higgs XS nominal = 1.40
A projection along the CLs = 0.05 line At what Higgs XS scale factordo you expect to be able to exclude the Higgs hypothesis ? SM only (2 sigma up) SM only (1 sigma up) 1.4 SM only (mean) Higgs XS / nominal Higgs XS SM only (1 sigma down) SM only (2 sigma down) Nominal luminosity
You can now scan over Higgs masses 1.4 Higgs XS / nominal Higgs XS The important thing is of course what you actually measured