Download
1 / 30
300 likes | 423 Views
Drift Time Analysis in ATLAS Muon Spectrometer Under Varying Gas Conditions. Llea Nasira Samuel Benedict College Charlotte Wood-Harrington Quarknet Research Program Advisor: Daniel Levin University of Michigan REU 2007 Wednesday 8 August, 2007. Purpose.

E N D
Drift Time Analysis in ATLAS Muon Spectrometer Under Varying Gas Conditions Llea Nasira Samuel Benedict College Charlotte Wood-Harrington Quarknet Research Program Advisor: Daniel Levin University of Michigan REU 2007 Wednesday 8 August, 2007 Llea Nasira Samuel
Purpose • What we are trying to understand if we can distinguishbetween two different scenarios for an observed change in the maximumdrift time: a change in CO2 or perhaps a small diffusion of water vaporinto the system. Llea Nasira Samuel
Muons and Muon Tracking • An elementary particle which can have either a positive or negative electric charge; spin of 1/2. • It is the decay product of many particles, one of these being the Higgs: H →Z Z*→ µ-µ+µ-µ+ • We can reconstruct events by identifying the muon’s tracks and measuring its momentum Llea Nasira Samuel
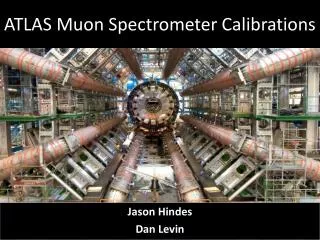
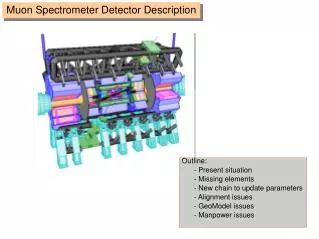
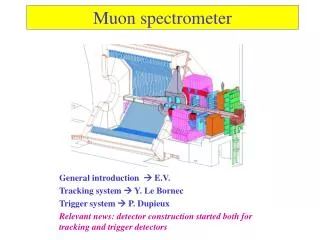
Muon Spectrometer • The muon spectrometer is used in the ATLAS experiment to identify and measure the muon momentum • One of its major components: Monitored Drift Tube Chambers • Drift Tubes help to provide precise co-ordinate measurements of the muon track Llea Nasira Samuel
A 3-D event display of a cosmic muon event, showing the path of a muon traveling through three layers of the barrel muon spectrometer. Three of the eight coils of the barrel toroid magnet can be seen in the top half of the drawing. Llea Nasira Samuel
MDT Chambers BARREL DRIFT TUBE CHAMBER Llea Nasira Samuel
Schematic view of MDT • Aluminum tubes: diameter= 30mm • Central tungsten wire: diameter= 50m • Tube length:1m-6m • ~ 1200 of these chambers in the ATLAS experiment Llea Nasira Samuel
MDTs Sense Wire: • Gold-plated Tungsten wire • r = 25μm • V= 3080 V • Stretched by 350g of tension Aluminum Tube: • radius inner= 1.46 cm • radius outer =1.5 cm Gas : • Mixture 93.0% Ar, 7.0% CO2 • Pressure: 3 bar • Temperature: ~293K Aluminum Tube Gas flow at 1V per day Sense Wire Llea Nasira Samuel
Tracking muons Aluminum Tube Electrons drifting toward sense wire Sense Wire Drift Radius Muon Track Llea Nasira Samuel
Drift Radius vs Drift Time (RT) Function Llea Nasira Samuel
Tracking muons Llea Nasira Samuel
Muon Paths Drift Tubes NOT drawn to scale MONTIORED DRIFT TUBE CHAMBER Llea Nasira Samuel
Mini MDT Chamber Scintillator Llea Nasira Samuel
Monitor on surface station SGX-1 Mini Drift Tube Chamber fresh gas Mixing station Cavern MDT CHAMBERS
Garfield Simulations and Results • Garfield: software package created by Rob Veenhof • Used to 1) model the MDT tube geometry 2) model the gas mixture 3) model the electric field 4) model the gas properties: temperature and pressure Llea Nasira Samuel
DR vs DT: Water Llea Nasira Samuel
DR vs DT: CO2 Llea Nasira Samuel
DR vs DT: Pressure DR vs DT: Temperature Llea Nasira Samuel
The graph shows the change in drift time vs drift radius when the mixture is at Ar: 92.4%, CO2: 7.6%. Barely any difference can be seen by the electrons within the first 4 mm from the sense wire. However, after this, there is a steady increase leading to an overall increase of about 0.7 s for the electrons coming -from the electron wall- to make it to the sense wire. Llea Nasira Samuel
The graph shows the change in time against the radius when the mixture is at Ar: 92.0%, CO2: 7.0%, H2O: 0.1%. This graph seems to show almost no change in the time taken for electrons to reach the sense wire for the first 0.4 cm. The difference comes after this as a steady rise is seen which makes a maximum time increase of a little less than 0.06 s. Llea Nasira Samuel
Drift Time Difference (ns) Llea Nasira Samuel
VERY PRELIMINARY Drift Time Difference (ns) Llea Nasira Samuel
Conclusions • With a lot more work still to be done, it may be possible to determine, with the use of Garfield, whether variation in DR-DT functions are caused by CO2, or by water contamination. Llea Nasira Samuel
Acknowledgements • Dr Daniel Levin • Prof Jean Krisch • Prof Homer Neal • Dr. Steven Goldfarb • Charlotte Wood-Harrington • All members of the MDT group • *** National Science Foundation *** • ***University of Michigan*** Llea Nasira Samuel