Download
1 / 1
10 likes | 150 Views
Reactive transport modeling of dissolved oxygen migration and consumption in a sedimentary basins affected by a deglaciation event Sergio Andrés Bea 1, 3 , Klaus Ulrich Mayer 1 , Kerry T B MacQuarrie 2 1 Earth and Ocean Sciences, University of British Columbia, Vancouver, BC, Canada.

E N D
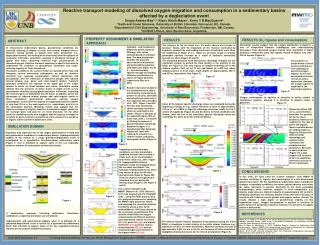
Reactive transport modeling of dissolved oxygen migration and consumption in a sedimentary basins affected by a deglaciation event Sergio Andrés Bea1, 3, Klaus Ulrich Mayer1, Kerry T B MacQuarrie2 1Earth and Ocean Sciences, University of British Columbia, Vancouver, BC, Canada. 2Department of Civil Engineering, University of New Brunswick, Fredericton, NB, Canada. 3CONICET-IHLLA, Azul, Buenos Aires, Argentina. ABSTRACT PROPERTY ASSIGNMENT & SIMULATION APPROACH RESULTS RESULTS (O2 ingress and consumption) Simulation results suggest that the oxygen distribution at depth is a sort of competition between hydrological and redox-buffering processes. Thus dissolved oxygen ingress most significant in higher hydraulic conductivity units, but ingress limited to depths less than ~ 200 m ingress (Figure 9). The advance of the ice sheet over the basin causes an increase in pressure heads, with the magnitude of the increase controlled by hydraulic conductivity and loading coefficient of individual units. Near the beginning of Stage III (i.e., 18000 yr), pressure heads in shallow permeable aquifers increase as a result of hydraulic connection beneath ice sheet (Figure 6A and B). The simulated pressure head and specific discharge changes are not significant enough to perturb the fluid density in the majority of the basin see Figure 6). The only regions of notable freshening are in the shallow aquifers Dol2 (at x=133 km) and Sand4 (at x=278 km) where isolated plumes of fresh water reach depths of approximately 350 m and 320 m, respectively (see Figure 7). In intracratonic sedimentary basins, geochemical conditions are currently reducing at depths of more than several hundred meters. However, during periods of glacial melt water production (i.e., deglaciation events), the melting of ice sheets may alter the patterns of freshwater infiltration, potentially resulting in enhanced recharge of glacial melt water containing relatively high concentrations of dissolved oxygen. Reactive transport modeling is used in this work to understand the evolution of geochemical conditions and redox-buffering capacity of these formations. Processes included in the current model are density-driven flow and transport, vertical mechanical deformation, as well as chemical reactions (e.g., aqueous complexation, mineral dissolution and precipitation, and the interaction of dissolved oxygen with reduced mineral phases (e.g., pyriteand solid organic matter). Transient boundary conditions are imposed on the upper part of the model domain to mimic ice sheet advance and retreat. Simulation results indicate that the presence of dense brines at depth results in low groundwater velocities during glacial meltwater infiltration, restricting the vertical ingress of meltwaters into the basin. In addition, due to the abundance of reduced mineral phases and solid organic matter in these formations, geochemical processes causing oxygen consumption further limit the ingress of oxygenated waters to depths of less than 100 m in the main aquifers (i.e., sandstones) and 50 m in the carbonates aquifers. Modeling results also suggest that the ingress of oxygen is slightly sensitive to assumed oxygen content in the recharge water and also the ice sheet thickness. On the other hand, the modeling results also suggests that the ingress of oxygen is sensitive to pyrite content in sandstones units, whereas it is sensitive to organic matter content in dolostones units. Hydraulic and mechanical properties where related to lithology, with values selected based on literature data. The data distribution includes the generally observed trend of porosity and permeability reduction with depth (see Figure 2A, B, C ). One-dimensional specific storage and loading efficiency coefficients are shown in Figure 2D and E, respectively (Bea et al., 2011). The presence of dense brines in these basins constitutes a first hydrological barrier to oxygen ingress. As ice and associated melt water retreat, O2 extent diminishes. However, the oxygen ingress is important in the dolostones aquifers. Figure 6 Reactive minerals included in the simulations were calcite and dolomite, assumed to be present in all units, and halite and anhydrite present only in the evaporites (Ev) units (Bea et al., 2011; Figure 1 and 4A). We have also considered cation-exchange reactions, which are dominant in the shales (Figure 1) because of the assumed higher CEC of these rock units (~ 5 meq/100 g). During the ingress of glacial meltwater containing dissolved oxygen, it is hypothesized that dissolved oxygen will react with reduced-Fe minerals (i.e., chlorite, biotite, and pyrite), and organic matter (Figure 3). Figure 9 Oxygen consumption in aquifers is sensitive to pyrite content in sandstones aquifers, whereas it is sensitive to organic matter in dolomites. Figure 2 Figure 10 Some of the highest specific discharge values are simulated during the beginning of Stage III: e.g., Sand2 mid-basin q value of approximately 0.23 m yr-1 at t=18000 yr. Specific discharge increases locally by 2 to 3 orders of magnitude (Figure 6C and D) relative to initial conditions (not shown). Near the end of the simulation specific discharge values are essentially the same as for the initial conditions. Elementary Effect (EE) on O2 concentrations show that it is positive for the ice sheet thickness, whereas it is negative for the case of pyrite and organic matter contents during the melting stage (i.e., Stage III). Because the different initial mineralogy and organic matter contents in the sandstones and dolostones, EE varies in space and time (Figure 10). Large negative EE for pyrite at 50 m in sandstone, whereas it is lesser at 50 m in dolostones. SIMULATION DOMAIN Glaciation may represent one of the largest perturbations to fluid flow and geochemical conditions in sedimentary basins. Hydrogeochemical stability in the context of a single glaciation/deglaciation event is investigated for a hypothetical two-dimensional sedimentary basin (Figure 1) that is intended to capture some of the key regionally-extensive features of intracratonic sedimentary basins Figure 3 Figure 3 Regarding surface boundary conditions, we have simulated a simplified scenario that includes a single cycle of ice sheet advance and retreat (Bea et al., 2011; Figure 4). Topographically-defined hydraulic heads were applied where the ice sheet was absent. The hydraulic head beneath the ice sheet was assumed equal to 0.95 Hice during retreat (Stage III, Figure 5B). Thus, the ingress of oxygenated is simulated to occur during the melting stage (Stage III, see Figure 4 and 5). Figure 4 CONCLUSSIONS Figure 7 In this work, we have used the reactive transport code MIN3P to simulate involving O2 ingress and consumption in a two-dimensional sedimentary basin. For the hypothetical sedimentary basin considered, changes in boundary conditions that mimic glacial advance and retreat do cause increases in specific discharge in the most permeable hydrogeologic units; however, changes in fluid composition (e.g. density, major ions) are limited to depths of approximately 300 to 400 m. Oxidizing conditions are limited to depths of less than 200 m because of reactions with reduced mineral phases and organic carbon. Overall, the results indicate a high degree of geochemical stability for this hypothetical basin.Oxygen consumption in aquifers is sensitive to pyrite content in sandstones aquifers, whereas it is sensitive to organic matter in dolostones. The reactive transport code MIN3P(Mayer et al., 2002; Bea et al., 2011) was coupled with the ITOUGH2 code, using the PEST protocol as a pre- and post-processor for sampling the MIN3P input parameter values and analyzing the simulation outputs. The Morris one-at-a-time (OAT) method [Morris, 1991] was chosen as the uncertainty quantification (UQ) method. Sensitivities for oxygen concentrations at different locations were determined relative to chlorite (EE_chl), pyrite (EE_py), and organic matter (EE_soc) contents, and ice sheet thickness (EE_ice) and the assumed oxygen concentration in the ingress water (EE_o2). Figure 5 Figure 1 REFERENCES Figure 8 A sedimentary sequence including dolostones, limestones, sandstones, evaporites and shales are considered. Hydrodynamic and geochemical stability when it is affected for a glaciation/deglaciation event is tested for a hypothetical sedimentary basin that intended to capture some of the key regionally-extensive features of intracratonic sedimentary basins. Mayer, K. U., Frind, E. O., Blowes, D. W. [2002]. Multicomponent reactive transport modeling in variably saturated porous media using a generalized formulation for kinetically controlled reactions. Water Resources Research, 38, 1174. Bea, S., Mayer, K., MacQuarrie, K. [2011]. Modelling Reactive Transport in Sedimentary Rock Environments - Phase II, MIN3P codeenhancements and illustrativesimulationsfor a glaciationscenario. Nuclear Waste Management Organization-NWMO TR-2011-13. Morris, M. D. [1991]. Factorial Sampling Plans For Preliminary Computational ExperimentsTechnometrics, Amer Statist Assn, 33, 161-174. The mineral volume fraction dissolved or precipitated during the entire 32500 yr simulation is small relative to the initial volume fractions (e.g., maximum of 0.35% for halite dissolution). Maximum porosity increase of approximately 0.004 occurs in the Ev unit because of halite dissolution; negligible porosity decreases due to mineral precipitation (Figure 8).


