Download
1 / 54
540 likes | 547 Views
Properties and radiative effects of desert dust in the Mediterranean Alcide Giorgio di Sarra ENEA , Rome, Italy. A. di Sarra 23/10/2014. radiation budget surface energy budget photochemistry heterogeneous chemistry air quality/health fertilization

E N D
Properties and radiative effects of desert dust inthe Mediterranean Alcide Giorgio di Sarra ENEA, Rome, Italy A. di Sarra 23/10/2014
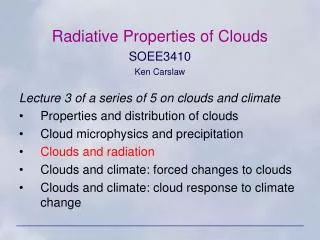
radiation budget surface energy budget photochemistry heterogeneous chemistry air quality/health fertilization atmospheric thermal structure/dynamics cloud properties …
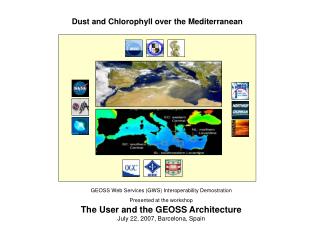
Moulin et al., 1998 METEOSAT, 1994
30 March 2013 MODIS-Terra
850 mb 1000 mb
1000 mb 850 mb
29 July 2005 MODIS-Terra
non-dust dust 1999-2008 Di Iorio et al., 2009
Summer Winter Marine Boundary Layer BoundaryLayer over land MBL Courtesy of S. Becagli
Radiative forcing ΔF = Fn,s – Fn
Refractive index Size Shape
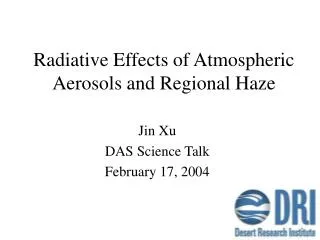
REFRACTIVE INDEX Formenti et al., 2011 Scheuvens et al., 2013
REFRACTIVE INDEX Di Biagio et al., 2014
SIZE DISTRIBUTION 700nm 550nm dV dV 450nm dlogDp dlogDp Denjean et al., 2013 22 and 28 June 2013: Transport from Tunisia to Lampedusa 22 june 2013, F35-36 Dust aerosols Altitude (m) F38 F35 28 june 2013, F38-39 Dust aerosols Similar dust source and days of transport but different mixing state Scat. coeff. (Mm-1) Diameter (µm) Numb. conc. (#.cm-3)
SIZE DISTRIBUTION Zhao et al., 2013
SHAPE Haanpanala et al., 2012 Surface direct radiative forcing
VERTICAL DISTRIBUTION Gomez Amo et al., 2010
All-sky clear-sky Papadimas et al., 2012 DRE TOA SW -10 0 DRE ATM SW 0 20 DRE SRF SW 2000-2007 -10 0
Satheesh and Ramanathan, 2000 Radiative forcing efficiency
PSP Cimel MFRSR PIR
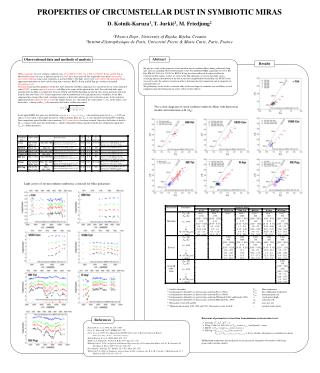
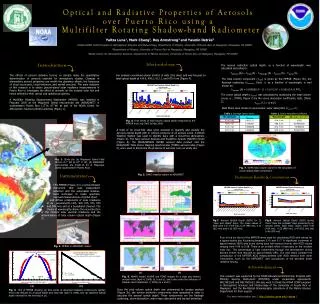
Surface aerosol FE: aerosol types 2004-2007 Di Biagio et al., 2010 Di Biagio et al., J. Geophys. Res., 2009
Aerosol FE at the top of the atmosphere Di Biagio et al., 2010
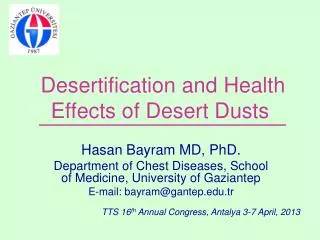
Daily mean aerosol forcing efficiency FES and FETOA at different θ integrated to obtain the daily FE The atmospheric forcing is ~30-50% of the surface forcing for DD, ~70% for UI-BB, and ~60% for MA. Di Biagio et al., 2010
Daily mean aerosol radiative forcing The daily mean radiative forcing (RFd) at TOA and at the surface are largest for DD due to the high value of both FEd and average τ. The atmospheric RFd, conversely, is approximately independent of the aerosol type.
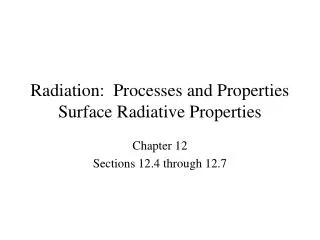
March 26, 11:50 UT MODIS-TERRA March 28, 2010 MODIS-TERRA March 26, 2010 March 28, 11:50 UT
MFRSR max 1.88 <0.09 PSP and PIR radiometers
instantaneous, at 35° solar zenith angle, LW, SW, and total forcing, for 26 March, 2010. SW: observations on two days, surface + CERES LW: RT model + observations at the surface and CERES On a daily basis: surface LW RF is about 50% of the SW TOA LW RF is about 40% of the SW a bout 75% of the SW atmospheric RF is compensated by the LW RF di Sarra et al., 2011
9:35 UTC MODIS 22 May 2013
12:50 UTC MODIS 22 May 2013
22 May, 12:57 UT 23 May, 13:46 UT Sky Imager 22 May, 12:50 UT Sky Imager 20 May, 12:50 UT
SW: Observations LW: Observations + MODTRAN 4.3 calculations Forcing efficiencies SW, global -136 W/m2 SW, diffuse +257 W/m2 LW +33 W/m2 LW/SW 24% instantaneous values!! Over a whole daily cycle FEd~FE/2 in the SW (di Sarra et al., 2011) LW/SW ~50%
Meloni et al., 2014 Ground-based and Airborne Measurements of the Aerosol Radiative Forcing (GAMARF) 2008
Vertical distribution • Optical properties • LW effects Recommendation: Closure with respect to high quality radiation measurements Thank you
Red – 2009 Green - 2010 Black – 2011 Blue -2012 Pace et al., 2012
Meloni et al., 2004 Lidar backscatter ratio JULY 14 2002 JULY 16 2002 HYSPLIT transport and dispersion model from the NOAA Air Resources Laboratory (ARL) AOD (500 nm) = 0.227 14 July α = 0.080 δ = 0.46-0.56 16 July α = 0.698 δ = 0.25-0.47
Meloni et al., 2004 MISR + MFRSR