Download
1 / 80
810 likes | 1.02k Views
8.1 Domain and Range. Section 8.1 p 1. Often there is a restriction on the numbers a function can take as inputs. For example, the function is not defined if L < 0, since the square root of a negative number is not real. Thus the inputs for f are values with L ≥ 0.

E N D
8.1 Domain and Range Section 8.1 p1
Often there is a restriction on the numbers a function can take as inputs. For example, the function is not defined if L < 0, since the square root of a negative number is not real. Thus the inputs for f are values with L ≥ 0. If Q = f(t), then • the domain of f is the set of input values, t, which yield an output value. • the range of f is the corresponding set of output values, Q. For the domain is all non-negative numbers. Section 8.1 p2
Example 1a For each of the following functions, find the domain. Finding the Domain: Evaluating Expressions If f is defined by an algebraic expression and no other information is given, we often take the domain to be all inputs x for which f(x) is defined. For example, we exclude any input that leads to dividing by zero or taking the square root of a negative number. Solution (a) Since the expression for f(x) is an algebraic fraction, we watch out for inputs that lead to dividing by zero. The denominator is zero when x = 2, Any other value of x is allowable, so the domain is all real numbers except x = 2. We sometimes write this as Domain: all real x ≠ 2. Section 8.1 p3
Example 1bcd For each of the following functions, find the domain. Finding the Domain: Evaluating Expressions (continued) Solution (b) Here we have an x in the denominator, so x = 0 is a problem: Any other input is allowable, so Domain: all real x ≠ 0. (c) Here we need to make sure that we are taking the square root of a number that is positive or zero. So we must have 1 − x ≥ 0, which means x ≤ 1. So Domain: x ≤ 1. (d) This time the order of subtraction under the square root is reversed, so we want x − 1 ≥ 0, which means x ≥ 1. So Domain: x ≥ 1. Section 8.1 p4
Example 2a Find the range of (a) h(x) = 5 − x Finding the Range: Solving Equations If the equation f(t) = −3 has a solution, then the number −3 is an output value of the function f. The range of f is the set of all outputs, so it is the set of numbers k for which the equation f(t) = k has a solution. Solution (a) We try to solve the equation h(x) = k, where k is an arbitrary number: 5 − x = k 5 = k + x x = 5 − k. Since k can be any number, we have Range: all real numbers. Section 8.1 p5
Example 2bc Finding the Range: Solving Equations (continued) Find the range of (b) f(t) = 3t + 5 (c) g(x) = 5 Solution (b) The equation f(t) = 3t + 5 = k always has the solution t = (k − 5)/3, no matter what the value of k. So we have Range: all real numbers. (c) The output is 5 no matter what the input, so the range consists of the single number 5. In general, if m is not zero, the range of a linear function f(x) = b + mx is all real numbers. Section 8.1 p6
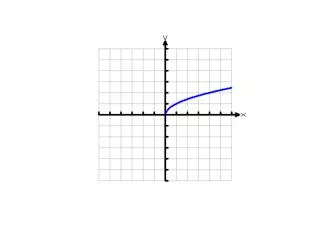
Visualizing the Domain and Range on the Graph For example, Figure 8.1 shows the graph of which we saw in Example 1(d) with domain x ≥ 1. The graph has no portion to the left of x = 1, starts at (1, 0), and has points corresponding to every number to the right of x = 1. Similarly, the range is the set of all values on the output axis with a corresponding point on the graph, or all real y ≥ 0. Figure 8.1: The domain of is x ≥ 1 An input value a for a function f corresponds to a point on the graph with x-coordinate a, and an output value b corresponds to a point with y-coordinate b. So the domain of f is the set of all values on the input axis for which there is a corresponding point on the graph. Section 8.1 p7
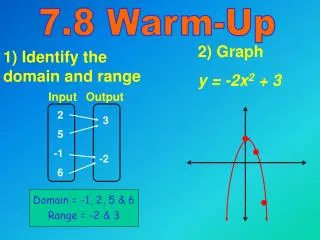
Example 3 Visualizing the Domain and Range on the Graph (continued) Estimate the domain and range of the function in Figure 8.2, assuming that the entire graph is shown. Figure 8.2: Find the domain and range of this function Solution Since the graph has points with x-coordinates between 1 and 6, these are the x-values for which f(x) is defined, so the domain is 1 ≤ x ≤ 6. To estimate the range, we look for the highest and lowest points on the graph. The highest point has y = 10, the lowest point has y = 1, and the graph appears to have points with every y-value in between, so the range is 1 ≤ y ≤ 10. Section 8.1 p8
For the function (a) Find the domain and range from its graph Example 4a Visualizing the Domain and Range on the Graph (continued) Solution (a) In Figure 8.3, we see that there is no point (x, y) on the graph with x = 1, because the vertical line x = 1 does not intersect the graph. Assuming that the graph keeps leveling out along the parts of the x-axis that are not visible, it appears that every other x-value has an associated y-value, so the domain is all real numbers x ≠ 1. (Solution for range continued on next slide.) Figure 8.3: The graph of g(x) = 1/(x − 1) Section 8.1 p9
For the function (a) Find the domain and range from its graph Example 4a (continued) Visualizing the Domain and Range on the Graph (continued) Solution (a) (Solution continued from previous slide.) Similarly, the only y-value that does not correspond to a point on the graph seems to be y = 0, since the horizontal line y = 0 does not intersect the graph anywhere. For any other value k ≠ 0, the horizontal line intersects the graph, so there is a point on the graph with y = k, and therefore k is an output of the function. So the range is all real numbers y ≠ 0. Figure 8.3: The graph of g(x) = 1/(x − 1) Section 8.1 p10
Visualizing the Domain and Range on the Graph (continued) For the function (b) Verify your answer algebraically. Example 4b Solution (b) The expression for g(x) is undefined when x = 1, because 1/(1 − 1) = 1/0 and division by 0 is undefined. It is defined for all other values of x, so Domain: all real x, x ≠ 1. To find the range, we check to see if y = k is an output of the function by seeing if the equation 1/(x − 1) = k can be solved for x. Provided k ≠ 0, the equation can be solved as follows: If k = 0, then the equation has no solution, since 1 divided by a number is never zero. Thus we have Range: all real y, y ≠ 0. Section 8.1 p11
Graph then find its domain algebraically. Example 5 Visualizing the Domain and Range on the Graph (continued) Solution The graph in Figure 8.4 lies to the right of the line x = 2, and appears to have a break at x = 6. Thus it appears that the domain is x ≥ 2, x ≠ 6. (Solution continued on next slide.) Figure 8.4 Section 8.1 p12
Graph then find its domain algebraically. Example 5 Visualizing the Domain and Range on the Graph (continued) Solution (continued) To confirm this algebraically, we need to know for what values of x the expression for f is defined, so we consider one by one the operations used in forming the expression. (a) Subtract 2 from x. This does not restrict the domain, since we can subtract 2 from any number. (b) Take the square root of x − 2.We cannot take the square root of a negative number, so the result of step (a) cannot be negative. Thus, x ≥ 2. (c) Subtract from 2. This does not restrict the domain, since we can subtract any number from 2. (d) Divide 5 by We cannot divide by 0, so cannot equal 2. Therefore, x − 2 cannot equal 4, and x cannot equal 6. (e) Putting steps (c) and (d) together, we see that the domain is x ≥ 2, x ≠ 6, as the graph suggests. Section 8.1 p13
Determining the Domain from the Context Example 6 If a function is being used to model a particular situation, we only allow inputs that make sense in the situation. For instance, in the function P = 0.111L1/2 for the period of a pendulum, a real pendulum would have to have positive length, so we should exclude L = 0, leaving L > 0. Find the domain of (a) The function f(A) = A/350 used to calculate the number of gallons of paint needed to cover an area A. (b) The function f giving the cost of purchasing n stamps, f(n) = 0.44n. Solution (a) Although the algebraic expression for f has all real numbers A as its domain, in this case we say f has domain A ≥ 0 because A is the area painted, and an area cannot be negative. (b) We can only purchase a whole number of stamps, or possibly no stamps at all, so the domain is all integers greater than or equal to 0. Section 8.1 p14
Example 7 Determining the Domain from the Context (continued) Find the domain of the function G = 0.75 − 0.3h giving the amount of gasoline, G gallons, in a portable electric generator h hours after it starts. Solution Considered algebraically, the expression for G makes sense for all values of h. However, in the context, the only values of h that make sense are those from when the generator starts, at h = 0, until it runs out of gas, where G = 0. Figure 8.5 shows that the allowable values of h are 0 ≤ h ≤ 2.5. Figure 8.5: Gasoline runs out when h = 2.5 We can also calculate algebraically the value of h that makes G = 0 by solving the equation 0.3h = 0.75, so when h = 0.75/0.3 = 2.5. Section 8.1 p15
Example 8a Domain and Range of a Power Function The domain of a power function f(x) = kxp, with k ≠ 0, is the values of x for which xp is defined. Graph the following functions and give their domain. (a) g(x) = x3 Solution See Figure 8.6. Figure 8.6: Domains of power functions (a) Since we can cube any number, the domain of g is all real numbers. Section 8.1 p16
Example 8b Domain and Range of a Power Function (continued) Graph the following functions and give their domain. (b) h(x) = x−2 Solution See Figure 8.6. Figure 8.6: Domains of power functions (b) We have Since we cannot divide by 0, we cannot input 0 into h. Any other number produces an output, so the domain of h is all numbers except 0. Notice that on the graph of h, there is no point with x = 0. Section 8.1 p17
Example 8c Domain and Range of a Power Function (continued) Graph the following functions and give their domain. (c) f(x) = x1/2 Solution See Figure 8.6. Figure 8.6: Domains of power functions (c) The domain of f is all non-negative numbers. Notice that the graph of f has no points with negative x-coordinates. Section 8.1 p18
Example 8d Domain and Range of a Power Function (continued) Graph the following functions and give their domain. (d) k(x) = x−1/3 Solution See Figure 8.6. Figure 8.6: Domains of power functions (d) We can take the cube root of any real number, but we cannot divide by 0, so the domain of k is all real numbers except 0. Section 8.1 p19
Domain and Range of a Power Function (continued) In general, we have the following rules for determining the domain of a power function: • xp is defined if x and p are positive • Negative powers of x are not defined at x = 0 • Fractional powers xn/m, where n/m is a fraction in lowest terms and m is even, are not defined if x < 0. The next examples show how we can also use these rules to decide whether a number a is in the range of a power function f(x) = kxp. Section 8.1 p20
Example 9a Domain and Range of a Power Function (continued) Find the range, and explain your answer in terms of equations. (a) f(x) = 2x2 Solution (a) The equation 2x2 = a is equivalent to x2 = a/2, which has no solutions if a is negative, and has the solution if a ≥ 0, so Range = all a such that a ≥ 0. We can see this from the graph of y = 2x2 in Figure 8.7. There is a point on the graph corresponding to every non-negative y-value. Figure 8.7: Graph of f(x) = 2x2 Section 8.1 p21
Example 9b Domain and Range of a Power Function (continued) Find the range, and explain your answer in terms of equations. (b) g(x) = 5x3 Solution (b) The equation 5x3 = a has the solution for all values of a, so Range = all real numbers. We also see this from the graph of y = 5x3 in Figure 8.8. There is a point on the graph corresponding to every number on the vertical axis. Figure 8.8: Graph of g(x) = 5x3 Section 8.1 p22
Find the range, and explain your answer in terms of equations. Example 9c Domain and Range of a Power Function (continued) Solution (c) The equation x−1 = a has the solution x = a−1 for all a except a = 0, so the range is all real numbers except 0. Figure 8.9 shows that there is a point on the graph for every y-value except 0. Figure 8.9: Graph of h(x) = x−1 Section 8.1 p23
Find the range, and explain your answer in terms of equations. Example 9d Domain and Range of a Power Function (continued) Solution (d) The equation −3/x−2 = a is equivalent to x2 = −3/a. The right-hand side must be positive for this to have solutions, so a must be negative. There is no solution if a = 0, since a is in the denominator. So the range is all negative numbers. Figure 8.10 shows that there are points on the graph for all negative y-values, and no points if y ≥ 0. Figure 8.10: Graph of k(x) = −3x−2 Section 8.1 p24
8.1DOMAIN AND RANGE Key Points • The domain of a function is the set of allowable inputs • The range of a function f(x) is the values k for which the equation f(x) = k is solvable • Finding the domain from the context Section 8.1 p25
8.2Composing and Decomposing Functions Section 8.2 p26
Example 1 Most countries measure temperature in degrees Celsius (°C), different from the degrees Fahrenheit (°F) used in the United States. The freezing point of water is 0°C and 32°F. Also, an increase of 1°C corresponds to an increase of 1.8°F. If the temperature is T in degrees Fahrenheit, then the corresponding temperature t in degrees Celsius is given by Describe the steps in evaluating this function and explain the significance of each step in terms of temperature scales. Solution Starting with the input T , we compute the output in the following two steps: • subtract 32, giving T − 32 • divide by 1.8, giving (T − 32)/1.8 The first step subtracts the freezing point, and gives the number of degrees Fahrenheit above freezing. The second step converts that into the number of degrees Celsius above freezing. Since freezing point is 0°C, this is the temperature in degrees Celsius. Section 8.2 p27
Each of the two steps in Example 1 is itself a function: • the “subtract 32” function, u = T − 32 • the “divide by 1.8” function, To obtain t, we take the output of the first function and make it the input of the second. Composition of Functions This process is called composing the two functions. In general, given two functions u = g(x) and y = f(u), the composition of f with g is y = f(g(x)). We call g the inside function and f the outside function. The process of composing two functions is similar to the process of evaluating a function, except that instead of substituting a specific number for the independent variable, you are substituting a function u = g(x). Section 8.2 p28
Example 2 If f(x) = 5x + 1 and g(x) = x2 − 4, find (a) f(2) (b) f(a) (c) f(a − 2) (d) f(x + 3) (e) f(g(x)) Composition of Functions (continued) Solution (a) We have f(2) = 5(2) + 1 = 10 + 1 = 11. (b) We have f(a) = 5a + 1. (c) We have f(a − 2) = 5(a − 2) + 1 = 5a − 10 + 1 = 5a − 9. (d) Using x + 3 as the input to f, we have f(x + 3) = 5(x + 3) + 1 = 5x + 15 + 1 = 5x + 16. (e) Using g(x) as the input to f, we have f(g(x)) = f(x2 − 4) = 5(x2 − 4) + 1 = 5x2 − 20 + 1 = 5x2 − 19. The order in which you compose two functions makes a difference, as the next example shows. Section 8.2 p29
Example 3 If f(x) = 2 + 3x and g(x) = 5x + 1, find (a) f(g(x)) (b) g(f(x)) Composition of Functions (continued) The order in which you compose two functions makes a difference, as the next example shows. Solution (a) We have f(g(x)) = f(5x + 1) = 2 + 3(5x + 1) = 5 + 15x. (b) We have g(f(x)) = g(2 + 3x) = 5(2 + 3x) + 1 = 11 + 15x. Notice that f(g(x)) ≠ g(f(x)) in this case. Section 8.2 p30
Example 4 After ten years, the value, V, in dollars, of a $5000 certificate of deposit earning annual interest x is given by V = 5000(1 + x)10. Express V as a composite of simpler functions and interpret each function in terms of finance. Expressing a Function as a Composition For functions modeling a real-world situation, expressing the function as a composition of smaller functions can often help make sense of it. Solution We choose u = 1 + x as the inside function, so that V = 5000u10 is the outside function. The inside function can be interpreted as the factor the balance is multiplied by each year. For example, if the interest rate is 5% then x = 0.05. Each year the balance is multiplied by u = 1 + x = 1.05. The outside function V = 5000u10 describes the effect of multiplying a balance of $5000 by a factor of u every year for 10 years. Section 8.2 p31
Example 5a Express each of the following as a composition of two simpler functions. (a) y = (2x + 1)5 Expressing a Function as a Composition (continued) If a function is given by a complicated expression, we can try to express it as a composition of simpler functions in order to better understand it. Solution (a) We define u = 2x + 1 as the inside function and y = u5 as the outside function. Then y = u5 = (2x + 1)5. (Continued on next slide.) Section 8.2 p32
Express each of the following as a composition of two simpler functions. (c) y = 2(5 − x2)3 + 1 Example 5bc Expressing a Function as a Composition (continued) Solution (b) We define u = x2 + 1 as the inside function and as the outside function. Then Notice that we instead could have defined and y = 1/u. There are other possibilities as well. There are multiple ways to decompose a function. (c) One possibility is to define u = 5 − x2 as the inside function and y = 2u3 + 1 as the outside function. Then y = 2u3 + 1 = 2(5 − x2)3 + 1. Again, there are other possible answers. Section 8.2 p33
Example 6 Explain why the functions y = (2x + 1)2, y = (x2 − 1)2, y = (5 − 2x)2 have no negative numbers in their range. Expressing a Function as a Composition (continued) By looking for ways to express functions as compositions of simpler functions, we can often discover important properties of the function. Solution Each function is of the form y = (expression)2, so we can write the function as a composition in which the outside function is y = u2. Since a square can never be negative, the values of y can never be negative. Section 8.2 p34
Example 7 Expressing a Function as a Composition (continued) As a spherical balloon inflates, its volume in cubic inches after t seconds is given by (a) Express V as a composition in which the outside function is the formula for the volume in terms of the radius, r, in inches: (b) Use your answer to (a) to determine how fast the radius is increasing. Solution (a) Comparing the formula for the volume in terms of t with the formula in terms of r, we see that they differ by a factor of 8, which is 23. So we can rewrite This is the composition of with r = 2t. (b) The inside function, r = 2t, tells us that the radius is growing at a rate of 2 in/sec. Section 8.2 p35
8.2COMPOSING AND DECOMPOSING FUNCTIONS Key Points • Reading an algebraic expression for a function to see how the function is built up • Composing and decomposing functions Section 8.2 p36
8.3Shifting and Scaling Section 8.3 p37
In the previous section we saw how to break the expression for a function into simpler components. It is also useful to be able to add components to a function. When we use functions to model real world situations, we often want to adjust an expression for a function that describes a situation in order to be able to describe a different but related situation. Section 8.3 p38
Example 1 Two balls are thrown in the air at the same time. After t seconds, the first has height h(t) = 90t − 16t2 feet and the second has height g(t) = 20 + 90t − 16t2. How do the expressions for the two functions compare with each other, and what does this say about the motion of the two balls? Adding a Constant to the Output: Vertical Shifts Solution Looking at the expressions for the two functions, we see that The expression for the height of the second ball is obtained by adding the constant 20 to the expression for the height of the first ball. This means that the second ball must be 20 feet higher than the first ball at all times. In particular, it was thrown from a position 20 feet higher. See Figure 8.11. Figure 8.11: Height of two balls thrown from different heights Section 8.3 p39
Example 2a Sketch the graph and give the range of each function. (a) y = x2 Adding a Constant to the Output: Vertical Shifts (continued) Notice that the effect of adding a constant to the output is simply to shift the graph of the function up by a certain amount. This also affects the range of the function, as the next example illustrates. Solution (a) See Figure 8.12(a). The expression x2 is never negative, but can take on any positive value, so we have Range: all real y ≥ 0. Figure 8.12: Vertical shifts of y = x2 Section 8.3 p40
Example 2b Sketch the graph and give the range of each function. (b) y = x2 + 1 Adding a Constant to the Output: Vertical Shifts (continued) Solution (b) For every x-value, the y-value for y = x2 + 1 is one unit larger than the y-value for y = x2. Since all the y-coordinates are increased by 1, the graph shifts vertically up by 1 unit. See Figure 8.12(b).We have Range: all real y ≥ 1. Figure 8.12: Vertical shifts of y = x2 Section 8.3 p41
Example 2c Sketch the graph and give the range of each function. (c) y = x2 − 3 Adding a Constant to the Output: Vertical Shifts (continued) Solution (c) The y-coordinates are 3 units smaller than the corresponding y-coordinates of y = x2, so the graph is shifted down by 3 units. See Figure 8.12(c). The range is Range: all real y ≥ −3. Figure 8.12: Vertical shifts of y = x2 Section 8.3 p42
Adding a Constant to the Output: Vertical Shifts (continued) In general, we have For a positive constant k, the graph of y = f(x) + k is the graph of y = f(x) shifted up by k units, and the graph of y = f(x) − k is the graph of y = f(x) shifted down by k units. Section 8.3 p43
Example 3 Two balls are thrown in the air one after the other. At time t seconds after the first ball is thrown, it has height h(t) = 90t−16t2 feet and the second ball has height g(t) = 90(t − 2)+16(t − 2)2. How do the expressions for the two functions compare with each other, and what does this say about the motion of the two balls? Adding a Constant to the Input: Horizontal Shifts Another adjustment we can make to a function is to add or subtract a constant to the input. Solution The expression for g(t) is obtained by replacing t with t − 2 in the expression for h(t). Thus the second ball always has the same height as the first ball had 2 seconds earlier. The second ball was thrown two seconds after the first ball, but after that its motion is exactly the same (see Figure 8.13). Figure 8.13: Height of two balls thrown at different times Section 8.3 p44
Example 4a Sketch the graph of each function and give its domain. Adding a Constant to the Input: Horizontal Shifts (continued) Notice that in Example 3, the effect of subtracting 2 from the input was to describe the motion of a ball that was lagging 2 seconds behind the first ball. Since this makes the motion of the ball occur 2 seconds later, its graph is shifted to the right by 2. Solution (a) See Figure 8.14(a). Since 1/x is defined for all x except x = 0, we have Domain: all real x, x ≠ 0. Figure 8.14: Horizontal shifts of y = 1/x Section 8.3 p45
Example 4b Sketch the graph of each function and give its domain. Adding a Constant to the Input: Horizontal Shifts (continued) Solution (b) See Figure 8.14(b). Notice that it is the same shape as the graph of y = 1/x, shifted 1 unit to the right. Since the original graph has no y-value at x = 0, the new graph has no y value at x = 1, which makes sense because 1/(x − 1) is defined for all x except x = 1, so Domain: all real x, x ≠ 1. Figure 8.14: Horizontal shifts of y = 1/x Section 8.3 p46
Example 4c Sketch the graph of each function and give its domain. Adding a Constant to the Input: Horizontal Shifts (continued) Solution (c) See Figure 8.14(c), which has the same shape as the graph of y = 1/x, shifted 3 units to the left. This time there is no y-value for x = −3, and 1/(x + 3) is defined for all x except x = −3, so Domain: all real x, x ≠ −3. Figure 8.14: Horizontal shifts of y = 1/x Section 8.3 p47
Adding a Constant to the Input: Horizontal Shifts (continued) In general, we have For a positive constant k, the graph of y = f(x − k) is the graph of y = f(x) shifted k units to the right, and the graph of y = f(x + k) is the graph of y = f(x) shifted k units to the left. Section 8.3 p48
Example 5a (a) Here the output values of are shifted up by 1. See Figure 8.16(a). Figure 8.16: Horizontal and vertical shifts of Vertical and Horizontal Shifts on Graphs Figure 8.15 shows the graph of Use shifts of this function to graph each of the following: Figure 8.15: Graph of Solution Section 8.3 p49
Example 5b (b) Since x − 1 is substituted for x in the expression the graph is a horizontal shift of the graph of Substituting x = 1 gives so we see that x = 1 in the new graph gives the same value as x = 0 in the old graph. The graph is shifted to the right 1 unit. See Figure 8.16(b). Figure 8.16: Horizontal and vertical shifts of Vertical and Horizontal Shifts on Graphs (continued) Figure 8.15 shows the graph of Use shifts of this function to graph each of the following: Figure 8.15: Graph of Solution Section 8.3 p50