Download
1 / 62
620 likes | 1.23k Views
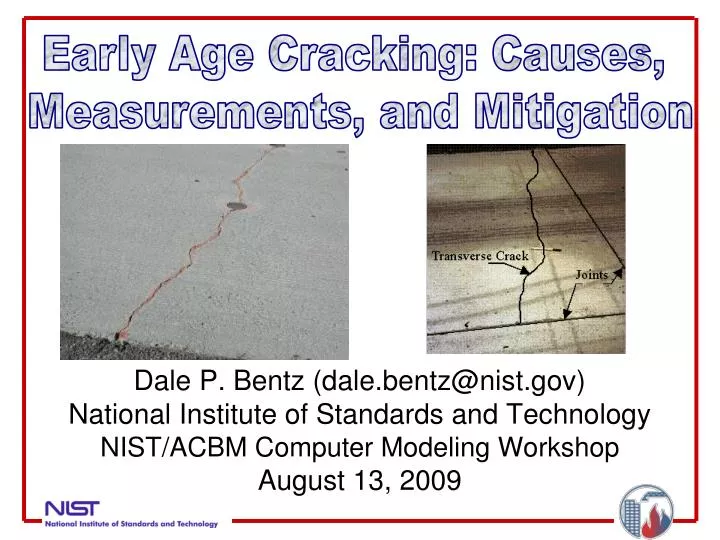
Early Age Cracking: Causes, Measurements, and Mitigation. Dale P. Bentz (dale.bentz@nist.gov) National Institute of Standards and Technology NIST/ACBM Computer Modeling Workshop August 13, 2009. Early-Age Performance of Concrete.

E N D
Early Age Cracking: Causes, Measurements, and Mitigation Dale P. Bentz (dale.bentz@nist.gov) National Institute of Standards and Technology NIST/ACBM Computer Modeling Workshop August 13, 2009
Early-Age Performance of Concrete • Criticality of early-age performance for long term durability • Cracking at early ages • Thermal considerations • Autogenous deformation considerations • Measurement technologies • Effect of cement fineness • Coarse cement – 311 m2/kg • Fine cement – about 380 m2/kg • Mitigation strategies
Concrete Goals • Structural and non-structural members that withstand their physical and environmental loads throughout their intended service life • Strength considerations (design-based) • Durability • Diffusivity, permeability, sorptivity • Freeze-thaw performance, corrosion, sulfate attack, ASR • Want to assure that HPC stands for “High Performance Concrete” and not “High Probability for Cracking”
Example of Importance of Early-Age Cracking 2003 FHWA Nationwide HPC Survey Results --- Most Common Concrete Distresses 1) Early-age deck cracking (56.6 % of responses were a 4 or 5=often) 2) Corrosion (42.3 % ---- definitely linked to cracking) 3) Cracking of girders, etc. (31.4 %) Others (sulfate attack, ASR, F/T, overload, poor construction quality were all below 25 % level) 2005 NRC/Canada report stated that “over 100,000 bridges in the U.S. have developed transverse cracking of their deck shortly after construction”
Importance of Early Age • All of the long term performance properties of a concrete are dictated by its proportioning, placement, and curing • If the concrete isn’t designed, prepared, transported, placed, finished, and cured properly, it will likely not perform as intended • It is during this early age, that concrete undergoes a remarkable transition from a viscous suspension to a rigid load-bearing durable solid
Cracking during Transition Heat generation • Thermal cracking Heat released during hydration causes temperature rise (50 oC or more) and expansion of concrete - reports of water boiling inside concrete in California Shrinkage will occur during subsequent cooling If heating/cooling is too rapid and/or concrete is restrained (externally or internally), cracking may occur Cooling
Cracking during Transition • Autogenous deformation Volume occupied by cement hydration reaction products is significantly less (10 % or more) than that of starting materials After setting (in a sealed system), this chemical shrinkage will be directly translated into a measurable autogenous deformation Once again, if concrete is restrained (externally or internally), cracking may occur Analogous to drying shrinkage, but drying is internal Autogenous shrinkage
What about high performance concretes (HPCs)? • Thermal cracking • HPCs usually contain more cementitious binder and perhaps silica fume, both of which accelerate and increase heat release rate and may exacerbate thermal cracking • Autogenous deformation cracking • Finer pore structure of HPC and greater self-desiccation both greatly increase autogenous deformation (and cracking)
Measurement Technologies • Early age heat generation and reaction rates • Isothermal calorimetry • Differential Scanning Calorimetry (DSC), TAMAir, Isocal, etc. • ASTM C1679-07 Standard Practice for Measuring Hydration Kinetics of Hydraulic Cementitious Mixtures Using Isothermal Calorimetry • Semi-adiabatic calorimetry • Adiacal, coffee cup, Q-drum, etc. • If you have a thermocouple, you can build your own!!! • Being standardized in ASTM C09.48/C01.48 • Chemical shrinkage • ASTM C1608-05 Standard Test Method for Chemical Shrinkage of Hydraulic Cement Paste • Loss on ignition • Difficult at early ages due to hydration continuing during specimen preparation, resolution issues
Measurement Technologies • Isothermal calorimetry assesses heat production at constant temperature conditions • Results can be expressed as heat flow or integrated to get total heat release vs. time • Generally limited to cement pastes or mortars • Isocal for concrete • Experiments at three different temperatures (10, 25, and 40 °C) can be used to estimate activation energy (needed for application of maturity method) w/c=0.35 cement pastes
Measurement Technologies • Semi-adiabatic calorimetry assesses temperature rise with controlled (or at least measured) heat loss • Results expressed as temperature vs. time • Can be used on pastes, mortars, or concretes • Can be used in both the field and in the laboratory • Mixture design • Quality control w/c=0.35 cement pastes
Some Limitations on Calorimetry Isothermal calorimetry from NIST • Calorimetry is being advocated by some as a means of assessing the setting time of cement-based materials • Basic problem with this is that calorimetry assesses the extent of hydration of the material while setting is a physical phenomenon (e.g., different extents of hydration are required to achieve setting depending on mixture proportions, etc.) …let’s consider w/c Setting data from NIST
Measurement Technologies • Chemical shrinkage assesses the imbibition of external water into a hydrating cement paste due to the fact that the hydration products occupy less volume than the reactants • Standardized in 2005 as ASTM C1608 by subcommittee C01.31 • Burrows has advocated that the 12-h chemical shrinkage be less than or equal to 0.0105 mL/g cement for a crack resistant cement (Burrows, et al., Three Simple Tests for Selecting Low-Crack Cement, Cement and Concrete Composites,26 (5), 509-519, 2004.)
Example of Chemical Shrinkage (CS) Hydration of tricalcium silicate C3S + 5.3 H C1.7SH4 + 1.3 CH Molar volumes 71.1 + 95.8 107.8 + 43 CS = (150.8 – 166.9) / 166.9 = -0.096 mL/mL or -0.0704 mL/g cement For each lb (g) of tricalcium silicate that reacts completely, we need to supply 0.07 lb (g) of extra curing water to maintain saturated conditions (In 1935, Powers measured a value of 0.053 for 28 d hydration – 75 %)
Measurement Technologies • Early age deformations and cracking • Corrugated tubes (with digital dilatometers) for mortar and paste autogenous deformation • Concrete cylinder or prism molds for concrete autogenous deformation • Cracking frames • Ring test for restrained shrinkage and early age cracking • Acoustic emission measurements
Measurement Technologies Custom-built digital dilatometers(Developed by Prof. O.M. Jensen – Technical University of Denmark) Specimens sealed in corrugated polymeric tubesand stored at constant temperature Method nearly approved by ASTM C09.68 AutoShrink equipment now available from Germann Instruments
Measurement Technologies for Concrete • For autogenous deformation of concrete, can use larger corrugated tubes, sealed prisms (next slide) or…. • Use plastic concrete cylinder molds with a simple dial gauge ---- (like conventional creep experiments) • Feasibility demonstrated by Craeye and De Schutter in Belgium and Brooks et al. in U.K. (references available upon request) NRMCA, Dec. 2007 Temperature control is critical
Measurement Technologies for Concrete Linear measurement of autogenous shrinkage (Japan 1999) Similar setup being used by Virginia Transportation Research Council and by one or more concrete producers in U.S. (specimen wrapped in plastic film) Possibilities for confounding: Temperature variation
Measurement Technologies for Concrete Schleibinger Shrinkage Drain 1 m long channel 60 mm by 38 mm (mortar) 60 mm by 100 mm (concrete) Neoprene sheets used to avoid wall friction Double-walled channel with heating and cooling also available Accuracy of about 2 μm Need to seal sample Used by group of Hansen et al. at University of Michigan Linear variants
Measurement Technologies for Concrete Modification to reduce friction Use a V-channel 285 mm by 40 mm by 45 mm One fixed and one moveable end LVDT with 0.15 μm accuracy Sealed with plastic film Newlands, M.D., Paine, K.A., Vemuri, N.A., and Dhir, R.K., “A Linear Test Method for Determining Early-Age Shrinkage of Concrete,” Magazine of Concrete Research, 60 (10), 747-757, 2008. Linear variants
Measurement Technologies for Concrete Modification to further reduce friction Spin the V-channel Schleibinger Shrinkage Cone Uses a laser to measure movement 0.3 μm resolution Temperature-controlled
Measurement Technologies for Concrete • Larger corrugated tubes • Concrete dilatometer • Presently, neither standardized nor commercially available Place in a temperature- controlled bath to minimize temperature variation? Under evaluation in Denmark, Sweden, Purdue, etc.
Measurement Technologies for Concrete Corrugated PVC tube immersed in temperature-controlled bath at LCPC in France Shape of corrugations and type of tube (impermeable, stable) can be important considerations In a very high performance concrete (VHPC), can still measure a temperature rise of 2 ºC during first 24 h of curing http://www.argenco.ulg.ac.be/etudiants/Multiphysics/StaquetS-Methodes_experimentales_part1.pdf
Measurement Technologies Large scale frame-based machines for monitoring early-age performance Rigid Cracking Frame developed at Technical University of Munich (based on Mangold 1998) Temperature-stress testing machine (Springenschmid 1980, 1985) Being employed in the U.S. by the group of Schlinder et al. at Auburn University
Measurement Technologies Restrained ring shrinkage and cracking test (ASTM C 1581 test method) Any questions: Contact Prof. Jason Weiss at Purdue Univ.
Measurement Technologies • Acoustic emission can be used to indicate microcracking and cavitation (self-desiccation) under sealed curing • Group at Purdue University (Prof. Weiss again) is also very active in this field
Mitigation Strategies • Thermal cracking • Use a low heat release cement (ASTM Type IV or invoke optional heat of hydration requirement on ASTM Type II – 290 J/g cement at 7 d) • Difficult to find in U.S. currently • U.S. cement finenesses constantly increasing since 1950
Mitigation Strategies • Thermal cracking • Reduce heat release rate by replacing cement with slowly reacting fly ash or slag • may increase autogenous shrinkage • Chilled aggregates or ice additions as part of mixing water • Use cooling pipes in large concrete pours ($$$$) • Liquid nitrogen cooling • Use phase change materials (PCMs) that “absorb” hydration heat during their phase change from solid to liquid (melting)
Mitigation Strategies • Mihashi, H, Nishiyama, N, Kobayashi, T, Hanada, M. Development of a Smart Material to Mitigate Thermal Stress in Early Age Concrete. In: Control of Cracking in Early Age Concrete, 2002. p. 385-392. • Use a hydration retarder encapsulated in a (paraffin) wax phase change material • During first hydration temperature rise, wax melts (absorbing energy during its phase change) and releases hydration retarder
Mitigation Strategies • Paraffin Wax as an example of a phase change material • Wax melts at around 50 °C • ΔH of about 150 J/g • For a typical concrete with 400 kg/m3 of cement • Maximum calculated temperature rise of 85 °C • With an addition of 350 kg/m3 of wax, maximum calculated temperature rise is reduced to 63 °C • Wax can be added in “powder” form to concrete or can be “embedded” in lightweight aggregates (LWA)
Mitigation Strategies Semi-adiabatic results on mortars with paraffin wax additions; the maximum temperature rise is decreased by about 8 °C and shifted to 1 h later; temperature decrease post peak is more gradual; could be extended to a blend of PCMs Bentz, D.P., and Turpin, R., “Potential Applications of Phase Change Materials in Concrete Technology,”Cem Concr Comp, 29 (7), 527-532, 2007.
Mitigation Strategies • Autogenous deformation and cracking • Magnitude of autogenous stresses are controlled by Kelvin-Laplace equation • Two variables that end user can exploit to their advantage are: • Decreasing surface tension (γ) of pore solution • Increasing the size of pores (rpore) being emptied during the self-desiccation that accompanies the ongoing chemical shrinkage Shrinkage reducing admixtures (SRA) Increased Cement Particle Spacing Internal Curing
Autogenous Deformation - SRAs • SRAs can reduce surface tension of pore solution by 50 % • Autogenous stresses should also be 50 % of level without SRA • Thus, SRAs may reduce autogenous shrinkage as well as drying shrinkage • SRAs also modify pore solution viscosity, and influence evaporative drying rates and plastic shrinkage cracking in a positive manner
Autogenous Deformation --- SRA w/cm=0.35 mortar, sealed curing, 30 oC
Drying with and without SRAs No SRA – Faster drying SRA – Slower drying
Some SRA References • Bentz, D.P., Geiker, M.R., and Hansen, K.K., “Shrinkage-Reducing Admixtures and Early Age Desiccation in Cement Pastes and Mortars,” Cement and Concrete Research, 31 (7), 1075-1085 2001. • Bentz, D.P., “Curing with Shrinkage-Reducing Admixtures: Beyond Drying Shrinkage Reduction,” Concrete International, 27 (10), 55-60, 2005. • Bentz, D.P., “Influence of Shrinkage-Reducing Admixtures on Early-Age Properties of Cement Pastes,” Journal of Advanced Concrete Technology, 4 (3), 423-429, 2006. • Lura, P., Pease, B. Mazzotta, G. Rajabipour, F., and Weiss, J. “Influence of Shrinkage-Reducing Admixtures on the Development of Plastic Shrinkage Cracks,” ACI Materials Journal, 104 (2), 187-194, 2007.
Concrete Solutions • Coarser Cements • Reduce temperature rise and decrease rate of temperature decrease during semi-adiabatic curing due to reduced reactivity (lower surface area) • Reduce autogenous shrinkage due to increased interparticle spacing • Strength reduction: 25% at 28 d w/c = 0.35 pastes Blaine fineness: Coarse – 310 m2/kg Fine – 380 m2/kg w/c = 0.35 mortars
Concrete Solutions • Increased w/c • Reduces temperature rise and decrease rate of temperature decrease during semi-adiabatic curing due to reduced cement content and increased heat capacity • Reduces autogenous shrinkage due to increased interparticle spacing • Strength reduction: 7% at 28 d Pastes Mortars
Concrete Solutions • Limestone (coarse) replacements for cement • Reduce temperature rise and decrease rate of temperature decrease during semi-adiabatic curing due to reduced cement content • Reduce autogenous shrinkage due to increased interparticle spacing (D50 of 50 to 100 μm) • Strength reduction: 7 % at 28 d Pastes Mortars
Some Cement Fineness References • Bentz, D.P., and Haecker, C.J., “An Argument for Using Coarse Cements in High Performance Concretes,” Cement and Concrete Research, 29, 615-618, 1999. • Bentz, D.P., Garboczi, E.J., Haecker, C.J., Jensen, O.M., “Effects of Cement Particle Size Distribution on Performance Properties of Cement-Based Materials,” Cement and Concrete Research, 29, 1663-1671, 1999. • Bentz, D.P., Jensen, O.M., Hansen, K.K., Oleson, J.F., Stang, H., and Haecker, C.J., “Influence of Cement Particle Size Distribution on Early Age Autogenous Strains and Stresses in Cement-Based Materials,” Journal of the American Ceramic Society, 84 (1), 129-135, 2001. • Bentz, D.P., Sant, G., and Weiss, W.J., “Early-Age Properties of Cement-Based Materials: I. Influence of Cement Fineness,” ASCE Journal of Materials in Civil Engineering, 20 (7), 502-508, 2008. • Bentz, D.P., and Peltz, M.A., “Reducing Thermal and Autogenous Shrinkage Contributions to Early-Age Cracking,” ACI Materials Journal, 105 (4), 414-420, 2008.
Autogenous Deformation - IC • In internal curing (IC), internal reservoirs of extra curing water are supplied within the 3-D concrete microstructure • Saturated surface-dry (SSD) lightweight aggregates (LWA) • Superabsorbent polymers (SAP) • Saturated wood fibers • Crushed returned concrete aggregate • Significantly reduces autogenous shrinkage at early and later ages • Reduces plastic and drying shrinkage as well • May also enhance hydration and strength in the longer term (7 d and beyond)
Question: Why do we need IC? Answer: Particularly in HPC, it is not easily possible to provide curing water from the top surface (for example) at the rate that is required to satisfy the ongoing chemical shrinkage, due to the extremely low permeabilities that are often achieved in the concrete as the capillary pores depercolate. Capillary pore percolation/depercolation first noted by Powers, Copeland and Mann (PCA-1959).
Cement paste Water reservoir
Autogenous Deformation Results w/cm=0.35 mortar, sealed curing, 30 oC Control
Autogenous Deformation Results CCA = crushed (returned) concrete aggregates Mortars with slag (20 %) blended cement IC added via fine LWA/CCA to increase total “w/c” from 0.30 to 0.38 (0.36) Note – chemical shrinkage of slag hydraulic reactions is~0.18g water/g slag or about2.6times that of cement
Degree of Hydration and Strength w/cm = 0.35 mortars, sealed curing w/cm = 0.3 HPM with silica fume blended cement
Three-Dimensional X-ray Microtomography • X-ray microtomography allows direct observation of the 3-D microstructure of cement-based materials • Example: Visible Cement Data Set http://visiblecement.nist.gov • In October 2005, experiments were conducted at Pennsylvania State University to monitor three-dimensional water movement during internal curing of a high-performance mortar over the course of two days
After mixing 1 d hydration 2 d hydration All images are 13 mm by 13 mm Aqua indicates drying Red indicates wetting Subtraction: 1 d – after mixing
Three-Dimensional X-ray Microtomography 2-D image with water evacuated regions (pores) overlaid on original microstructure (4.6 mm by 4.6 mm) Three-dimensional subtracted image of 1 d hydration – initial microstructure showing water-filled pores that have emptied during internal curing (4.6 mm on a side)