Download
1 / 1
10 likes | 95 Views
Helsinki , 30 to 02 august 2010 TECO 2010. GHARDAIA INTERCOMPARISON:presentation and data analysis using MySql. Mezred Mohamed Office National de la Météorologie Avenue Khemisti BP 153 – Dar EL Beida, Alger, Algérie m.mezred@meteo.dz Centre National Climatologique

E N D
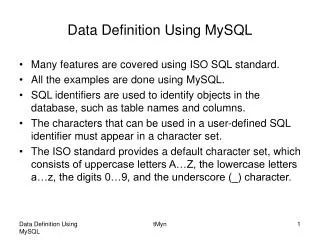
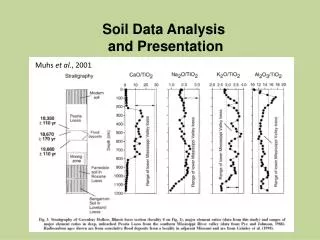
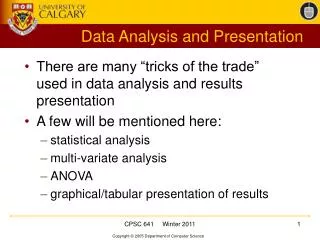
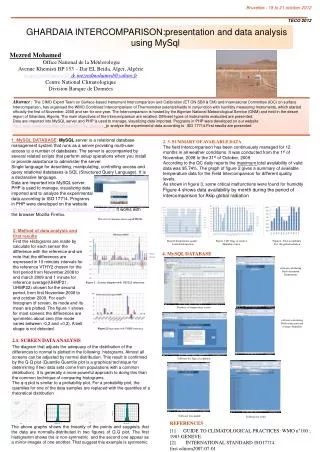
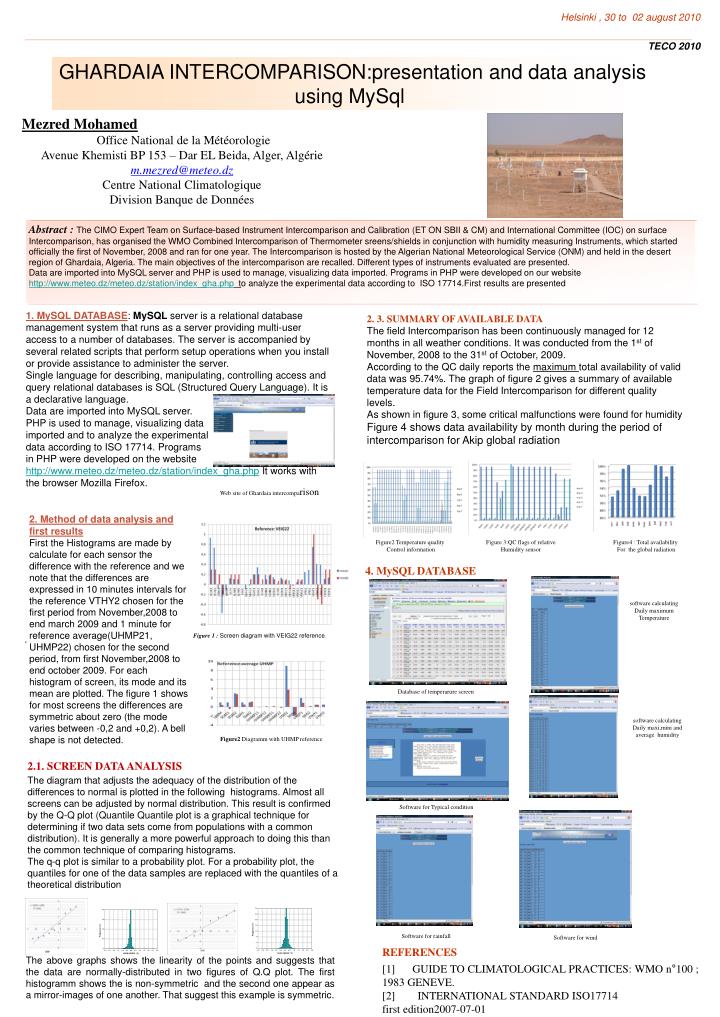
Helsinki , 30 to 02 august 2010 TECO 2010 GHARDAIA INTERCOMPARISON:presentation and data analysis using MySql Mezred Mohamed Office National de la Météorologie Avenue Khemisti BP 153 – Dar EL Beida, Alger, Algérie m.mezred@meteo.dz Centre National Climatologique Division Banque de Données Abstract : The CIMO Expert Team on Surface-based Instrument Intercomparison and Calibration (ET ON SBII & CM) and International Committee (IOC) on surface Intercomparison, has organised the WMO Combined Intercomparison of Thermometer sreens/shields in conjunction with humidity measuring Instruments, which started officially the first of November, 2008 and ran for one year. The Intercomparison is hosted by the Algerian National Meteorological Service (ONM) and held in the desert region of Ghardaia, Algeria. The main objectives of the intercomparison are recalled. Different types of instruments evaluated are presented. Data are imported into MySQL server and PHP is used to manage, visualizing data imported. Programs in PHP were developed on our website http://www.meteo.dz/meteo.dz/station/index_gha.php to analyze the experimental data according to ISO 17714.First results are presented 1. MySQL DATABASE: MySQL server is a relational database management system that runs as a server providing multi-user access to a number of databases. The server is accompanied by several related scripts that perform setup operations when you install or provide assistance to administer the server. Single language for describing, manipulating, controlling access and query relational databases is SQL (Structured Query Language). It is a declarative language. Data are imported into MySQL server. PHP is used to manage, visualizing data imported and to analyze the experimental data according to ISO 17714. Programs in PHP were developed on the website http://www.meteo.dz/meteo.dz/station/index_gha.php It works with the browser Mozilla Firefox. 2. 3. SUMMARY OF AVAILABLE DATA The field Intercomparison has been continuously managed for 12 months in all weather conditions. It was conducted from the 1st of November, 2008 to the 31st of October, 2009. According to the QC daily reports the maximum total availability of valid data was 95.74%. The graph of figure 2 gives a summary of available temperature data for the Field Intercomparison for different quality levels. As shown in figure 3, some critical malfunctions were found for humidity Figure 4 shows data availability by month during the period of intercomparison for Akip global radiation . Web site of Ghardaia intercomparison 2. Method of data analysis and first results First the Histograms are made by calculate for each sensor the difference with the reference and we note that the differences are expressed in 10 minutes intervals for the reference VTHY2 chosen for the first period from November,2008 to end march 2009 and 1 minute for reference average(UHMP21, UHMP22) chosen for the second period, from first November,2008 to end october 2009. For each histogram of screen, its mode and its mean are plotted. The figure 1 shows for most screens the differences are symmetric about zero (the mode varies between -0,2 and +0,2). A bell shape is not detected. Figure2 Temperature quality Control information Figure 3:QC flags of relative Humidity sensor Figure4 : Total availability For the global radiation 4. MySQL DATABASE software calculating Daily maximum Temperature . Figure 1 :Screen diagram with VEIG22 reference. Database of temperarure screen software calculating Daily maxi,mini and average humidity Figure2 Diagramm with UHMP reference 2.1. SCREEN DATA ANALYSIS The diagram that adjusts the adequacy of the distribution of the differences to normal is plotted in the following histograms. Almost all screens can be adjusted by normal distribution. This result is confirmed by the Q-Q plot (Quantile Quantile plot is a graphical technique for determining if two data sets come from populations with a common distribution). It is generally a more powerful approach to doing this than the common technique of comparing histograms. The q-q plot is similar to a probability plot. For a probability plot, the quantiles for one of the data samples are replaced with the quantiles of a theoretical distribution Software for Typical condition Software for rainfall Software for wind REFERENCES [1] GUIDE TO CLIMATOLOGICAL PRACTICES: WMO n°100 ; 1983 GENEVE. [2] INTERNATIONAL STANDARD ISO17714 first edition2007-07-01 The above graphs shows the linearity of the points and suggests that the data are normally-distributed in two figures of Q.Q plot. The first histogramm shows the is non-symmetric and the second one appear as a mirror-images of one another. That suggest this example is symmetric.