Download

1 / 7
70 likes | 197 Views
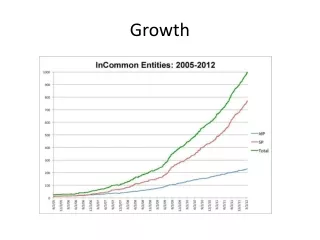
Capcity Growth. Growth of installed Capacity. GROWTH OF 400 KV TRANSMISSION SYSTEM IN. EASTERN REGION. 6604. 5935. 5535. 5535. 6000. 5535. 5500. 4608. 5000. 4500. 3978. 3978. 4000. 3500. 3318. CKT KM. 3000. 2500. 2182. 1878. 2000. 1500. 1287. 983. 983. 1000. 557.

E N D
GROWTH OF 400 KV TRANSMISSION SYSTEM IN EASTERN REGION 6604 5935 5535 5535 6000 5535 5500 4608 5000 4500 3978 3978 4000 3500 3318 CKT KM 3000 2500 2182 1878 2000 1500 1287 983 983 1000 557 427 387 500 236 0 0 1985 1986 1987 1988 1989 1990 1991 1992 1993 S1 1994 1995 1996 1997 1998 1999 2000 2001 2002 2003 YEAR
Problems Encountered • Poor Hydro Thermal Mix • Adverse Peak – off-Peak ratio • Very High off peak Frequency , Low peak frequency • Forced Backing Down • Machines under Reserve Shut Down • Absence of Rational Commercial mechanism “Bottled Energy”