Download
1 / 1
20 likes | 219 Views
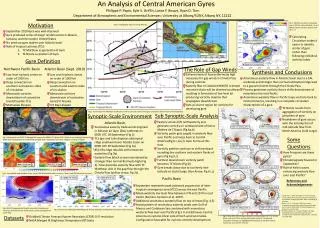
A Climatology of Central American Gyres. A43F-0208. Philippe P. Papin, Kyle S. Griffin, Lance F. Bosart , Ryan D. Torn. Department of Atmospheric and Environmental Sciences: University at Albany/SUNY, Albany NY, 12222. * Corresponding author e-mail: ppapin@ albany .edu. Motivation.

E N D
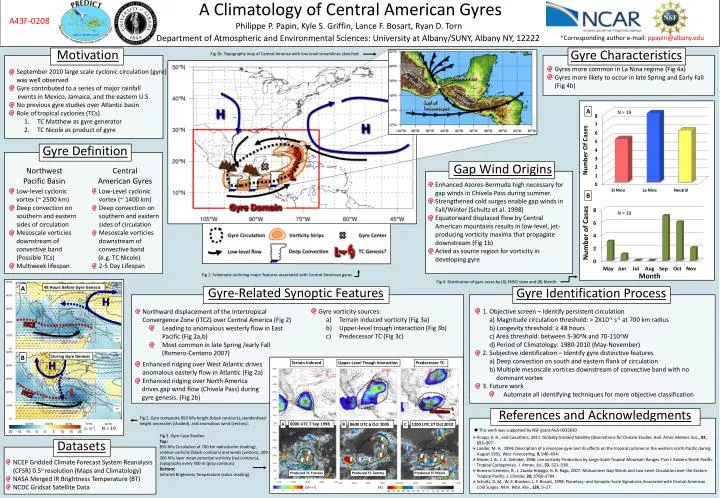
A Climatology of Central American Gyres A43F-0208 Philippe P. Papin, Kyle S. Griffin, Lance F. Bosart, Ryan D. Torn Department of Atmospheric and Environmental Sciences: University at Albany/SUNY, Albany NY, 12222 *Corresponding author e-mail: ppapin@albany.edu Motivation Fig 1b. Topography map of Central America with low-level streamlines sketched Gyres more common in La Nina regime (Fig 4a) Gyres more likely to occur in late Spring and Early Fall (Fig 4b) • September 2010 large scale cyclonic circulation (gyre) was well observed • Gyre contributed to a series of major rainfall • events in Mexico, Jamaica, and the eastern U.S. • No previous gyre studies over Atlantic basin • Role of tropical cyclones (TCs) • TC Matthew as gyre generator • TC Nicole as product of gyre A N = 19 Gyre Definition Gyre Characteristics Gap Wind Origins Northwest Pacific Basin Central American Gyres Enhanced Azores-Bermuda high necessary for gap winds in Chivela Pass during summer. Strengthened cold surges enable gap winds in Fall/Winter (Schultz et al. 1998) Equatorward displaced flow by Central American mountains results in low-level, jet-producing vorticity maxima that propagate downstream (Fig 1b) Acted as source region for vorticity in developing gyre Low-level cyclonic vortex (~ 2500 km) Deep convection on southern and eastern sides of circulation Mesoscalevorticies downstream of convective band (Possible TCs) Multiweek lifespan Low-Level cyclonic vortex (~ 1400 km) Deep convection on southern and eastern sides of circulation Mesoscalevorticies downstream of convective band (e.g. TC Nicole) 2-5 Day Lifespan B N = 19 Fig 1. Schematic outlining major features associated with Central American gyres. Gyre Identification Process Gyre-Related Synoptic Features References and Acknowledgments Fig 4. Distribution of gyre cases by (A) ENSO state and (B) Month. A 48 Hours Before Gyre Genesis H • 1. Objective screen – Identify persistent circulation • a) Magnitude circulation threshold: > 2X10⁻⁵ s-1at 700 km radius • b) Longevity threshold: ≥ 48 hours • c) Area threshold: between 5-30oN and 70-110oW • d) Period of Climatology: 1980-2010 (May-November) • 2. Subjective identification – Identify gyre distinctive features • a) Deep convection on south and eastern flank of circulation • b) Multiple mesoscalevortices downstream of convective band with no dominant vortex • 3. Future work • Automate all identifying techniques for more objective classification • Gyre vorticity sources: • Terrain induced vorticity (Fig 3a) • Upper-level trough interaction (Fig 3b) • Predecessor TC (Fig 3c) • Northward displacement of the Intertropical Convergence Zone (ITCZ) over Central America (Fig 2) • Leading to anomalous westerly flow in East Pacific (Fig 2a,b) • Most common in late Spring /early Fall • (Romero-Centeno 2007) ITCZ B During Gyre Genesis H Enhanced ridging over West Atlantic drives anomalous easterly flow in Atlantic (Fig 2a) Enhanced ridging over North America drives gap wind flow (Chivela Pass) during gyre genesis. (Fig 2b) Terrain Induced Upper-Level Trough Interaction Predecessor TC L ITCZ TC Matthew Fig 2. Gyre composite 850 hPa height (black contours), standardized height anomalies (shaded), and anomalous wind (vectors). 0000 UTC 7 Sep 1998 A B 0600 UTC 6 Oct 2005 1200 UTC 27 Oct 2010 C N = 19 • This work was supported by NSF grant AGS-0935830 Fig 3. Gyre Case Studies: Top: 850 hPa Circulation at 700 km radius(color shading), relative vorticity (black contours)and winds (vectors), 200-300 hPa layer mean potential vorticity (red contours), topography every 500 m (gray contours) Bottom: Infrared Brightness Temperature (color shading) • Knapp, K. R., and Coauthors, 2011: Globally Gridded Satellite Observations for Climate Studies. Bull. Amer. Meteor. Soc., 92, • 893–907. • Lander, M. A., 1994: Description of a monsoon gyre and its effects on the tropical cyclones in the western north Pacific during August 1991. Wea. Forecasting, 9, 640–654. • Mozer, J. B., J. A. Zehnder, 1996: Lee vorticity Production by Large-Scale Tropical Mountain Ranges. Part I: Eastern North Pacific Tropical Cyclogenesis. J. Atmos. Sci., 53, 521–538. • Romero-Centeno, R., J. Zavala-Hidalgo, G. B. Raga, 2007: Midsummer Gap Winds and Low-Level Circulation over the Eastern Tropical Pacific. J. Climate, 20, 3768–3784. • Schultz, D. M., W. E. Bracken, L. F. Bosart, 1998: Planetary- and Synoptic-Scale Signatures Associated with Central American • Cold Surges. Mon. Wea. Rev., 126, 5–27. Datasets NCEP Gridded Climate Forecast System Reanalysis (CFSR) 0.5o resolution (Maps and Climatology) NASA Merged IR Brightness Temperature (BT) NCDC Gridsat Satellite Data Produced TC Frances Produced TC Tammy Produced TC Nicole [10-5 s-1] [oC]