Download

1 / 39
390 likes | 619 Views
Ch 9. Perfect Competition. Characteristics. Fragmented Undifferentiated products Perfect information about prices equal Access to resources. Implications. Price taker Law of one price Zero-profit in the long run. Economic Profit. Economic profit vs account profit.

E N D
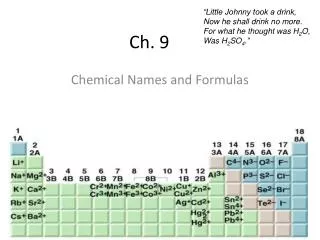
Ch 9 • Perfect Competition
Characteristics • Fragmented • Undifferentiated products • Perfect information about prices • equal Access to resources
Implications • Price taker • Law of one price • Zero-profit in the long run
Economic Profit • Economic profit vs account profit
(Figure continues on next slide) Besanko & Braeutigam/Microeconomics: An Integrated Approach Chapter 9, Figure 09-01 FIGURE 9-1 Profit Maximization by a Price-Taking Firm
Besanko & Braeutigam/Microeconomics: An Integrated Approach Chapter 9, Figure 09-01 continued FIGURE 9-1 (Continued)
Whose fixed costs are all sunk : P=0.05 q=25, loss=TFC+(avc25-P)25 ;q=0,;loss=TFC FIGURE 9-2 Short-Run Supply Curve for a Price-Taking Firm
FIGURE 9-3 Short-Run Supply Curve for a Firm with Nonsunk Fixed Costs P=0.15,q=35, 則loss=TFC+35(ansc35-0.15) q=0,loss=TFC
Besanko & Braeutigam/Microeconomics: An Integrated Approach Chapter 9, Figure 09-04 FIGURE 9-4 Supply Curve for Learning-By-Doing Exercise 9.2
Besanko & Braeutigam/Microeconomics: An Integrated Approach Chapter 9, Figure 09-05 FIGURE 9-5 Supply Curve for a U.S. Corn Farmer
Besanko & Braeutigam/Microeconomics: An Integrated Approach Chapter 9, Figure 09-06 FIGURE 9-6 Short-Run Market Supply Curve
Besanko & Braeutigam/Microeconomics: An Integrated Approach Chapter 9, Figure 09-07 FIGURE 9-7 Supply Curves for Copper in 2000
Besanko & Braeutigam/Microeconomics: An Integrated Approach Chapter 9, Figure 09-08 FIGURE 9-8 Perfectly Inelastic and Perfectly Elastic Supply Curves
Besanko & Braeutigam/Microeconomics: An Integrated Approach Chapter 9, Figure 09-09 FIGURE 9-9 Short-Run Equilibrium
Besanko & Braeutigam/Microeconomics: An Integrated Approach Chapter 9, Figure 09-10 FIGURE 9-10 Comparative Statics Analysis: Increase in the Number of Firms
Besanko & Braeutigam/Microeconomics: An Integrated Approach Chapter 9, Figure 09-11 FIGURE 9-11 The Impact of a Shift in Demand on Price Depends on the Price Elasticity of Supply
Besanko & Braeutigam/Microeconomics: An Integrated Approach Chapter 9, Figure 09-12 FIGURE 9-12 The Short-Run Supply Curve for Roses
Besanko & Braeutigam/Microeconomics: An Integrated Approach Chapter 9, Figure 09-13 FIGURE 9-13 The Price of Electricity in the Nord Pool, 1999
Besanko & Braeutigam/Microeconomics: An Integrated Approach Chapter 9, Figure 09-14 FIGURE 9-14 Long-Run Output and Plant Size Adjustment by a Price-Taking Firm
Besanko & Braeutigam/Microeconomics: An Integrated Approach Chapter 9, Figure 09-15 FIGURE 9-15 The Firm’s Long-Run Supply Curve
Besanko & Braeutigam/Microeconomics: An Integrated Approach Chapter 9, Figure 09-16 FIGURE 9-16 Long-Run Equilibrium in a Perfectly Competitive Market
Besanko & Braeutigam/Microeconomics: An Integrated Approach Chapter 9, Figure 09-17 FIGURE 9-17 Relationship Between Number of Internet Service Providers and the Size of the Market in 1998
Long-run market supply curves • Input prices changes
Besanko & Braeutigam/Microeconomics: An Integrated Approach Chapter 9, Figure 09-18 FIGURE 9-18 Long-Run Industry Supply Curve
Besanko & Braeutigam/Microeconomics: An Integrated Approach Chapter 9, Figure 09-19 FIGURE 9-19 Spot Price to Charter a Supertanker, January 1973-March 1976
Besanko & Braeutigam/Microeconomics: An Integrated Approach Chapter 9, Figure 09-20 FIGURE 9-20 The Collapse of the Oil Tanker Market, 1973–1975
Besanko & Braeutigam/Microeconomics: An Integrated Approach Chapter 9, Figure 09-21 FIGURE 9-21 Long-Run Industry Supply Curve in an Increasing-Cost Industry
Besanko & Braeutigam/Microeconomics: An Integrated Approach Chapter 9, Figure 09-22 FIGURE 9-22 Economic Rent
Besanko & Braeutigam/Microeconomics: An Integrated Approach Chapter 9, Figure 09-23 FIGURE 9-23 Producer Surplus for a Price-Taking Firm
Besanko & Braeutigam/Microeconomics: An Integrated Approach Chapter 9, Figure 09-24 FIGURE 9-24 Market-Level Producer Surplus: Number of Firms in the Industry is Fixed
Besanko & Braeutigam/Microeconomics: An Integrated Approach Chapter 9, Figure 09-25 FIGURE 9-25 Producer Surplus in the World Copper Market
Besanko & Braeutigam/Microeconomics: An Integrated Approach Chapter 9, Figure 09-26 FIGURE 9-26 Producer Surplus at the Long-Run Equilibrium in an Increasing-Cost Industry