Download
1 / 58
580 likes | 656 Views
Managing Better and Smarter. Business Intelligence May 10, 2007 Sponsored by the Business Intelligence Community. Presenters. Mary Hill, Programmer Analyst Supervisor MSIS maryhill @umich.edu M.S. in Computer Science 20-some years experience in Commercial and University IT

E N D
Managing Better and Smarter Business Intelligence May 10, 2007 Sponsored by the Business Intelligence Community
Presenters Mary Hill, Programmer Analyst Supervisor MSIS • maryhill@umich.edu • M.S. in Computer Science • 20-some years experience in Commercial and University IT • Responsible for applications development/ deployment and planning
Presenters Karen Dannemiller, Assoc Director Med School IS • karendan@umich.edu • M.S. /B.S. in Computer Science • 20-some years University experience in IT • Responsible for applications development/ deployment and planning
Overview • All experiencing revenue slow downs… • Research $$ available from the government • Educational support from the State • Schools need to be proactive • If we wait to be reactive, it will be too late • Schools need to focus on what is important • Schools need to manage better/smarter
Managing Better and Smarter • What is important to us? • Where are we now? • Are we where we should be? • Don’t wait for me to ask.
What’s Important to us? • Leadership tells us what’s important • We work out… • What to measure • Where to find the appropriate data
What’s Important to us? • For example • Leadership says that research is important. • We gather $ expended, $ submitted and $ awarded by department and by researcher by year • We all agree on the data source and the calculations used.
We are so lucky!! • We are blessed with a rich /wonderful data warehouse • General Ledger • Human Resources • Actual Payroll plus Expected Payroll • Space • Etc… • In our example • We extracted research $ expended from the GL. • We extracted researchers from HR. • We gathered research $ submitted and awarded from our own application.
-Alert Medical School Data Warehouse
Managing Better and Smarter • What is important to us? • Where are we now? • Reports • Report system • Are we where we should be? • Don’t wait for me to ask.
What do we want in a report system? • Good Reports • Create quality reports which provide the data to facilitate decision making • Easily Accessible • Would be nice to have ALL reports in ONE place • And preferably on the web • Easy to find the report you’re looking for • Appropriate security
-Alert Medical School Data Warehouse
Our official version of the truth • Simple Navigation through more than 100 reports.
Select Report Category: • Conflict of Interest Management • Faculty HR • Faculty Profile • Research Expenditures and Space • Research Submissions and Awards • Space Management • Teaching Effort
Table of contents Report Catalog if unsure…
Select a department Generate Report Want report emailed? Add to favorites
Category: Submissions and Awards Topic: Committed Awards Group: Department Report: Committed by Fed FY
Category: Expenditures and Space Group: Department Topic: Research Expenditures Report: Research Spending Trend
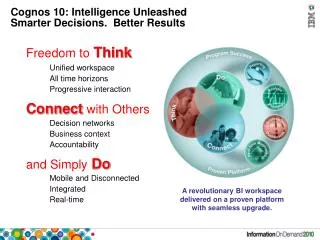
What is the Output? M-Stat Outcomes… • Don’t worry about getting it right the first time. • Functional and Technical staff work together to create useful reports quickly • Iterate. Update reports based on user feedback
What is the Output? but…. We had REPORTS.
What was wrong? • Our PBO said that he had lots of reports, but that he only used them for a doorstop. • Using our example, he could look at the reports and see research $ expended, awarded, proposals submitted by department by year. • He could see the current numbers for a particular department AND he could he the trend, but… • that didn’t tell him whether they were doing a good job or not.
Managing Better and Smarter • What is important to us? • Where are we now? • Are we where we should be? • Don’t wait for me to ask.
What drives the Medical School Toward Success? Are we where we should be? • PBO created a task force and asked us to • Obtain better understanding of metrics currently in use to manage various units of the Medical School • Determine relevant KPIs and Benchmarks • Ensure consistency with EVPMA and Dean’s Strategic Vision • Create a Dashboard to facilitate an accessible shared understanding of organizational direction
Survivor Revisited Are we where we should be? (cont.) KPI’s – Key Performance Indicators • Find and implement a better way to benchmark: • Financial Performance • Research Performance • Clinical Performance • Educational Performance • Management Performance
Performance Measurement: Attributes Attributes of Key Performance Indicators • Representative - Reflect mission/values of the School • Inclusive – based on inputs from those being measured • Dynamic – reviewed periodically • Comprehensive – Key financial and productivity data • Benchmarked – Past, Peer and External • Motivating – Promotes excellence, creativity and collaboration • Customized – Different measures for different departments
Performance Measurement: Pyramid of Integrated Measures Interrelation of KPIs Limited in number Department’s primary accountability to School Thresholds to layout minimal (maximal) levels of performance Key 2-4 per mission Of interest to School Examined if problems with key indicators/thresholds Strategic Department Departments maintain/monitor them Defined at Department/Section/Faculty level May vary from (and within) departments Section Operational Faculty
What Drives Success… KPIs as the common language • These are the metrics that the Dean will watch • These are the way we will benchmark • No more long discussions on how you got to your numbers and we got to ours… • Transparency between departments
What Drives Success… Back to our example • Are we using our space wisely? • Space Productivity KPI: Research $ / Sq Ft • What research $ do we use? • All research $ for a department? • Only research performed in Med School space? • What space data do we use? • Do we include shared space? • Just include lab space? • Refined definitions over time (Definition C/4) • Now we can compare one department to another and to other Medical Schools.
What Drives Success… What research $ do we use? • Must be Federal / NonFederal Fund Group • Exclude if… • P/Gs coded as Undergrad / Grad Scholarship • Research done off campus • P/G is a clinical trial • NIH construction or equipment • VA or IPA agreement • Subcontracted • Research not performed in “Med School occupied space”
What Drives Success… What space do we use? • Must be • Captured in M-Pathways space database • “Assignable Square Feet” – excludes restrooms, stairwells.. • Space occupied by medical school department • Exclude if Sheep Barn or Occupied by ULAM • Include if room type = … • Lab, Lab Service • Office by Pct coded as Research function • Animal Quarters • Animal Quarters Services, if Room subtype is Surgery
Build me a Dashboard I want … • To see our metrics • Transparency • The ability to do simple ‘what if’ analyses
-Alert -Stat (Reporting) Medical School Data Warehouse
Functional Lead would draw it. IT would implement it.
What is the Output? Insert slide shots of MDash reports here…This is the demo
What is the Output? Insert slide shots of MDash reports here…This is the demo
What is the Output? Insert slide shots of MDash reports here…This is the demo
What is the Output? Insert slide shots of MDash reports here…This is the demo
What is the Output? Insert slide shots of MDash reports here…This is the demo
M-Dash – Surprises and Lessons Learned Dashboard Outcomes… • Surprises • Dashboard Transparency – Not a big deal • Dashboard creation and implementation was relatively quick • Lessons Learned • Numbers must tie back to something users already trust. • Provide drill down for every table, every graph • People REALLY care about productivity when their salary is tied to it.
Managing Better and Smarter • What is important to us? • Where are we now? • Are we where we should be? • Reports, charts to show where we are with respect to our goals. • Don’t wait for me to ask. • Just tell me when something needs my attention. • Reports should come to me when I need to see them.
-Alert -Stat (Reporting) Medical School Data Warehouse
M-Alert M-Alert • Expected Range of values for KPI is set • KPIs are compare to range when data changes • Automatically generates an e-mail to the user, if outside range
Alert M-Alert Email Service 07/01/2004 You have 1 Alert: Alert 1: Sample Department – Percent Faculty Salary On Grants Decreased By 5% Or More % Chg from 4/1/04 to 7/1/04 = -7% More information at URL: https://www.umms.med.umich.edu/dashboard/
Summary • What is important to us? • Need the Data. • Where are we now? • Quality reports and a Report System. • Are we where we should be? • KPIs and benchmarks in a dashboard • Don’t wait for me to ask. • Just tell me when something needs my attention. • Reports should come to me when I need to see them.
-Alert -Stat (Reporting) Medical School Data Warehouse