Download
1 / 40
400 likes | 408 Views
BRFSS Maps: Visualizing Oral Health Surveillance Data. James B. Holt, M.P.A., Ph.D. Centers for Disease Control and Prevention. Pittsburgh, PA May 4, 2005. Outline of Presentation. Basic concepts: data tables vs. maps Purpose and functionality of BRFSS Maps

E N D
BRFSS Maps: Visualizing Oral Health Surveillance Data James B. Holt, M.P.A., Ph.D. Centers for Disease Control and Prevention Pittsburgh, PA May 4, 2005
Outline of Presentation • Basic concepts: data tables vs. maps • Purpose and functionality of BRFSS Maps • Future enhancements to BRFSS Maps • Summary
Data Tables vs. Maps • Different ways of looking at the data • Specific values (tables) or spatial patterns in the data (maps)? • In other words: “detail” vs. “simplification” • Data for analysis (tables) or data for visualization (maps)? • Access to ancillary information (tables)? • Confidence intervals • Cell sizes • Comparison of two or more variables
Maps: Static vs. Interactive • Static = one-of-a kind snapshot • If data are updated - map is outdated • Okay if you anticipate a one-time need • Can be produced in a graphics package or a geographic information system (GIS) • Interactive = dynamic • If data are updated – map automatically updates • Good for one-time needs as well as periodic updates • Can be produced via a GIS, with internet-enabled interactivity, controlled by end-user
BRFSS Maps • Interactive • GIS-enabled • Internet-based mapping application • Visual depiction of BRFSS data • States • Metropolitan and Micropolitan Statistical Areas (MMSA)
Purposes • Visualization and exploratory spatial data analysis • Highlight regional patterns and interstate variations • Prompt interesting research questions • BRFSS data in a GIS-friendly format • Encourage the use of geographically-referenced risk factor data
Functionality • View state and MMSA data together or separately • User selectable class breaks • Zoom, pan, and prevalence rate retrieval • User selectable labeling • Image downloading • GIS data downloading • Access to mapping guidance
BRFSS Maps Development Timeline • Conceptual development: July 2003 • Technical planning & layout: October 2003 • User feedback: February 2004 • Version 1.0: August 2004 • Enhancement planning: continuous • Version 1.1: January 2005 • Version 2.0: June 2005, expected
User Control over Mapping Options • Natural breaks • Quantiles • Equal intervals • Standard deviations
New DevelopmentsSince Initial Release • Improved internet response time in Version 1.1 • Adapted for rapid response to emerging public health issues (e.g., influenza vaccination surveillance, 2004-05)
System Components • Web server • IIS (Microsoft web server software) • ASP.Net (webpage development software) • Database server • SQL Server 2000 • NCCDPHP data repository • GIS server • ArcIMS • Internet GIS development • map generation
Database Server System Architecture Get the data… Send map request I want to see a map! Web Server HTTP request Retrieve dataset image streamed back Web Browser Data being mapped are passed to GIS service image streamed back ArcIMS generates map image GIS Server
GIS Web Service • Mapping capability easily integrated into existing Web sites • Increased data security • GIS service does not require database access • Mapped data sent with each map request • Sensitive datasets are not exposed • Performance enhancement • Very fast response time • No lengthy browser downloads
BRFSS Maps Future Enhancements • Version 2.0 • New user interface • Redesigned map frame • New visualization tools • Versions 3.0 and 4.0 • Visualization of multivariate relationships • Visualization of county-level data
New Visualization Tools • Natural breaks • Quantiles • Equal intervals • Standard deviations • Manual breaks
Visualization of Multivariate Relationships • Many options… • Map-to-map comparison • Bivariate map (e.g., Census map) • Proportional symbol over choropleth • Stacked bars over choropleth • Conditioned choropleth • Would require cognitive testing and technical feasibility study
Mapping County-level BRFSS Data • Data availability (sample size) • Statistical noise • Spatial smoothing & small area ests. • Purpose and limitations of maps of spatially smoothed sample data • Pattern recognition • Rate retrieval
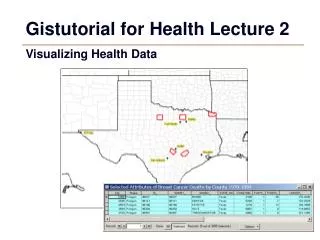
Raw Data Counties > 50 interviews *
Raw Data All Counties
Spatially-Smoothed All Counties
Isopleth Map Spatially-Smoothed
Cognitive Issues • Rate retrieval and recall • Pattern recognition and recall • Map comparison • Visual dominance • User preferences
Technical Issues • Data-related • Cartography-related • Internet-related
Summary • BRFSS Maps enables visualization of oral health and other public health surveillance data • Development emphasized usability and utility • Future developments will focus on visualizing multivariate relationships, county-level mapping and additional functionality • Innovation in mapping…not merely an “out-of-the-box” application
Questions or Comments? • Jim Holt • jgh4@cdc.gov • 770-488-5510 • BRFSS Maps • http://apps.nccd.cdc.gov/gisbrfss/
Visualization of County Level Data • Planned for BRFSS Maps version 3.0 or 4.0 • Many technical and cognitive issues